- Web
TerraScope
A natural-disaster monitoring and incident-response platform: it pulls live earthquake, volcano, wildfire and storm data, checks it against alert rules, and gives response teams a Situation Room to run an incident from the first alert to the after-action review.
- Personal project, full-stack
- 46 REST controllers, 45 Flyway migrations
- Live USGS and NASA EONET hazard feeds
- Java, Spring Boot, PostgreSQL, Flyway, Next.js, React, TypeScript, Leaflet, Docker
The problem
When an earthquake or a wildfire hits, the first signal arrives in a public feed, the decisions are made in calls and chats, and the record of who did what is pieced together afterwards. A response team needs to see the hazard, know when it crosses a line they care about, and run the incident in one place that can be reviewed later.
The approach
TerraScope follows an incident through five stages: monitor the live hazard feeds, alert when an event matches a rule, respond in the Situation Room, review with situation reports and an after-action review, and operate the installation with roles, an activity log and exports.
It is built to keep working. Everything starts with one command, and when a feed can't be reached the backend serves a small built-in sample and marks it as not live, so the app stays usable offline. Sign-in is optional, for installations shared by more than one person.
Who uses it
- Viewers
- See all the data, run simulations and regional analysis, evaluate alert rules and verify records.
- Operators
- Run incidents and change data: alerts, watchlists and resilience records. They can also open the activity log.
- Administrators
- Manage users and take the governance closure actions.
What it does
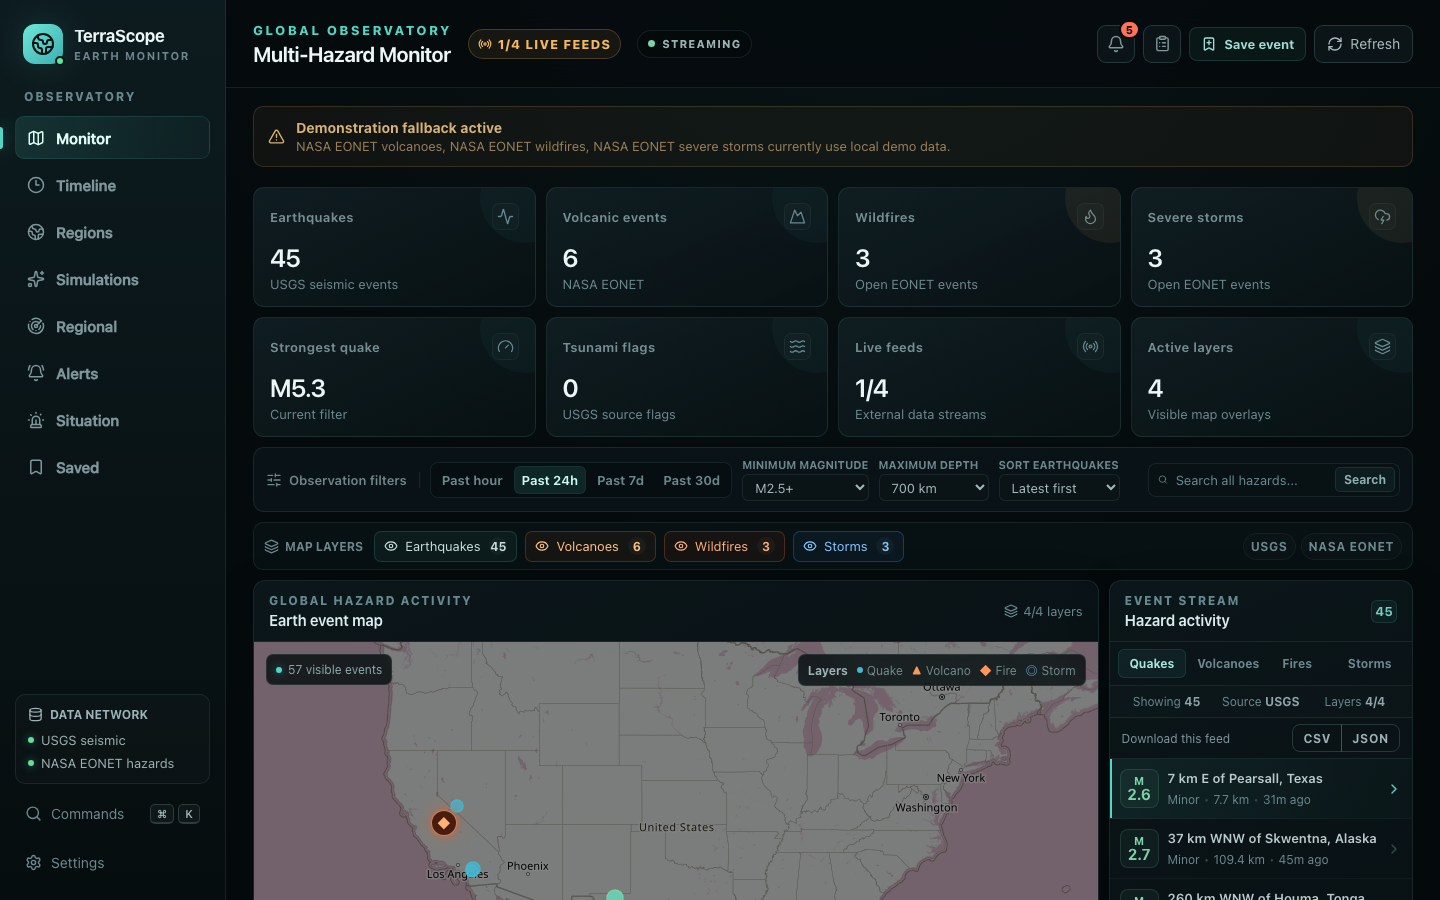
- A live hazard map and event stream: earthquakes from USGS, and volcanoes, wildfires and severe storms from NASA EONET
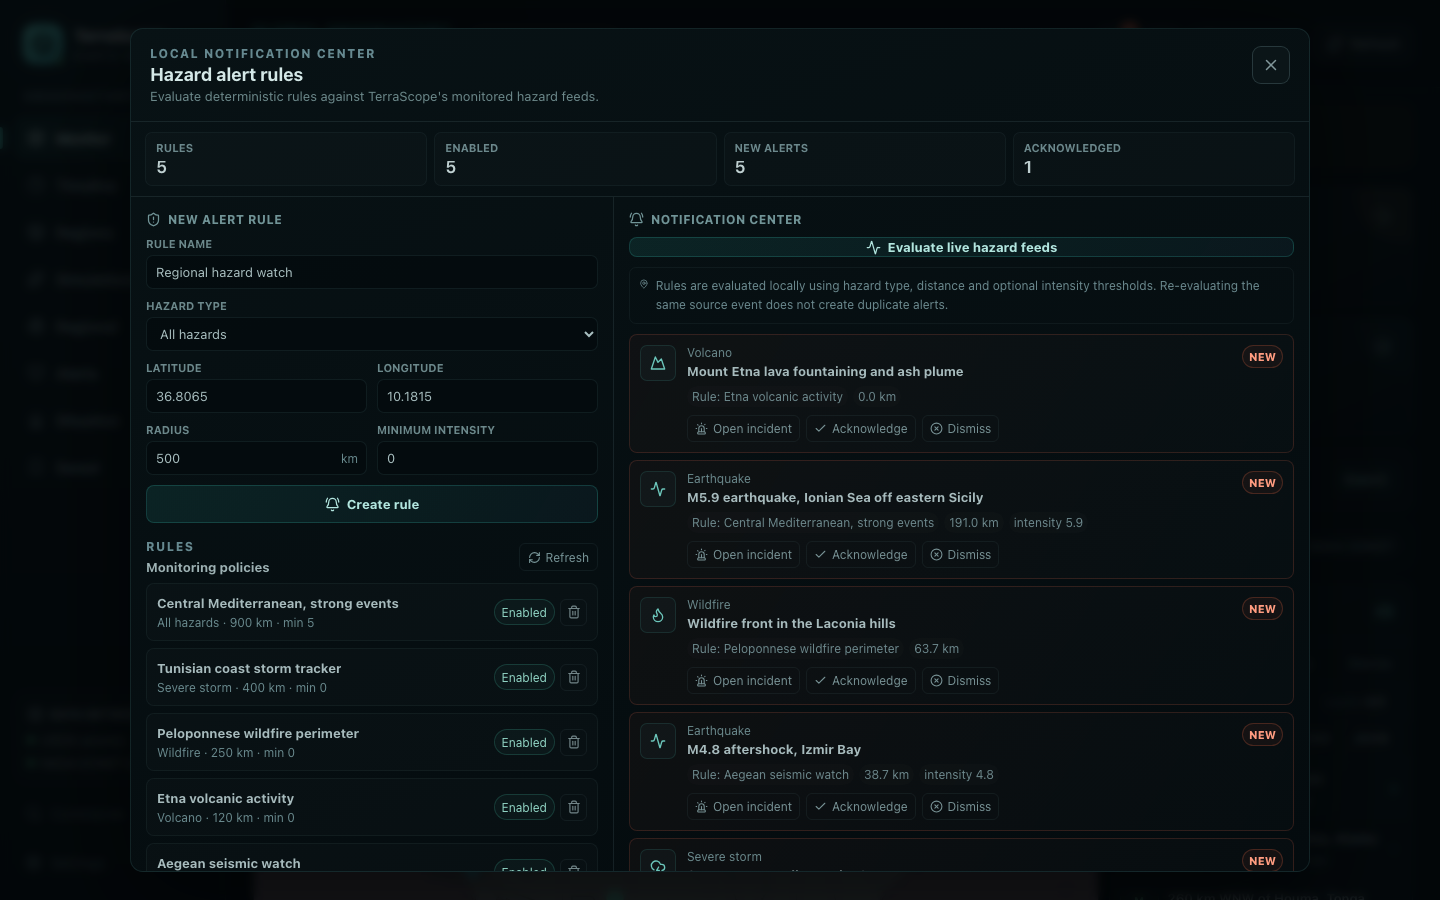
- Alert rules by hazard, location, radius and minimum intensity, evaluated every two minutes and on demand
- Alerts pushed to the browser over Server-Sent Events, with a toast and a notification bell
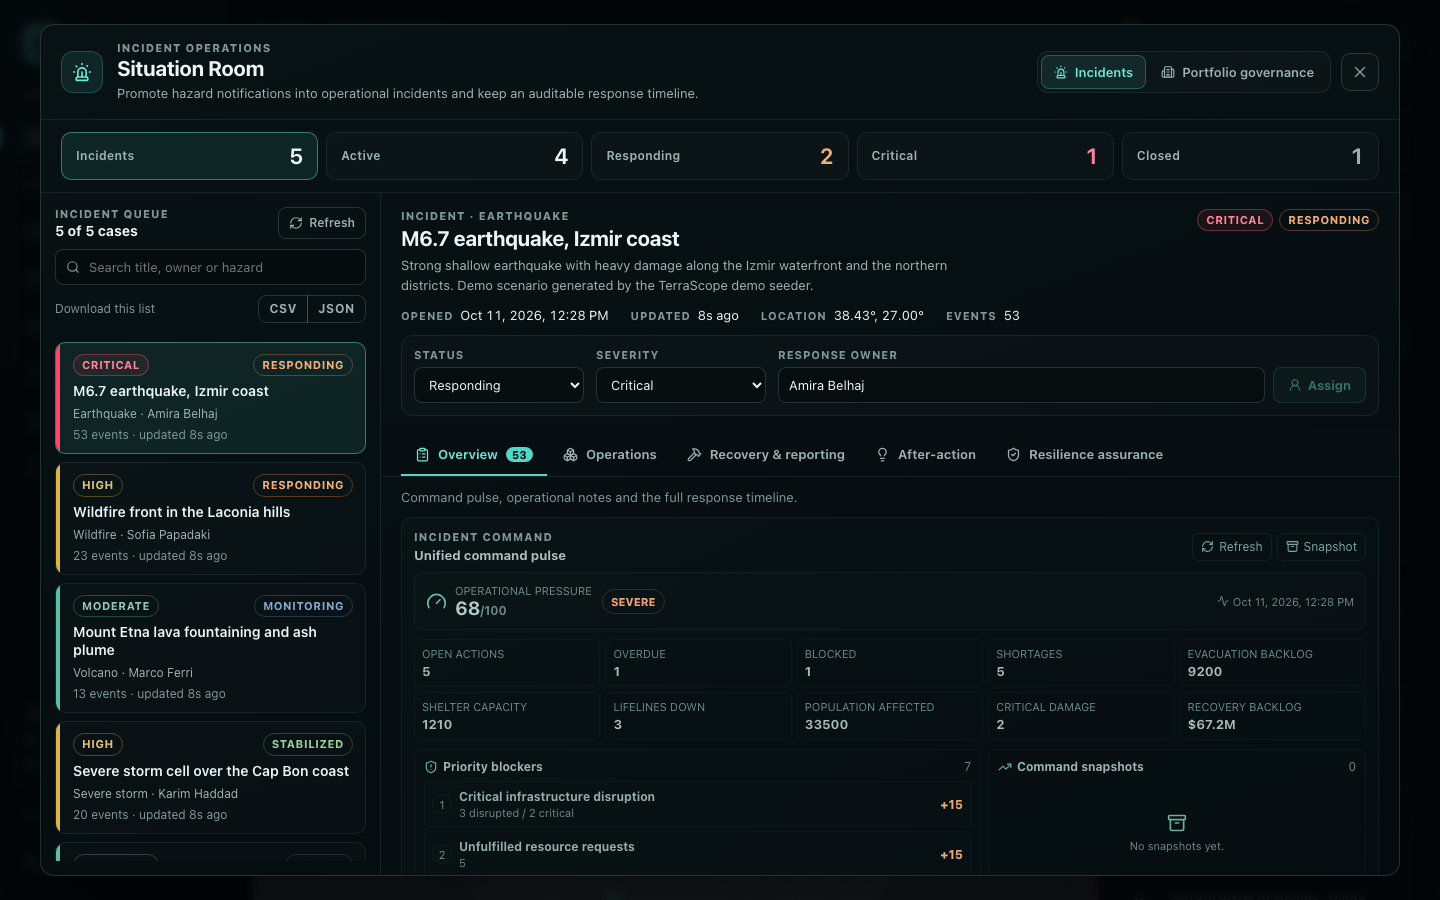
- A Situation Room for each incident, with an owner, a severity, a status and a full timeline
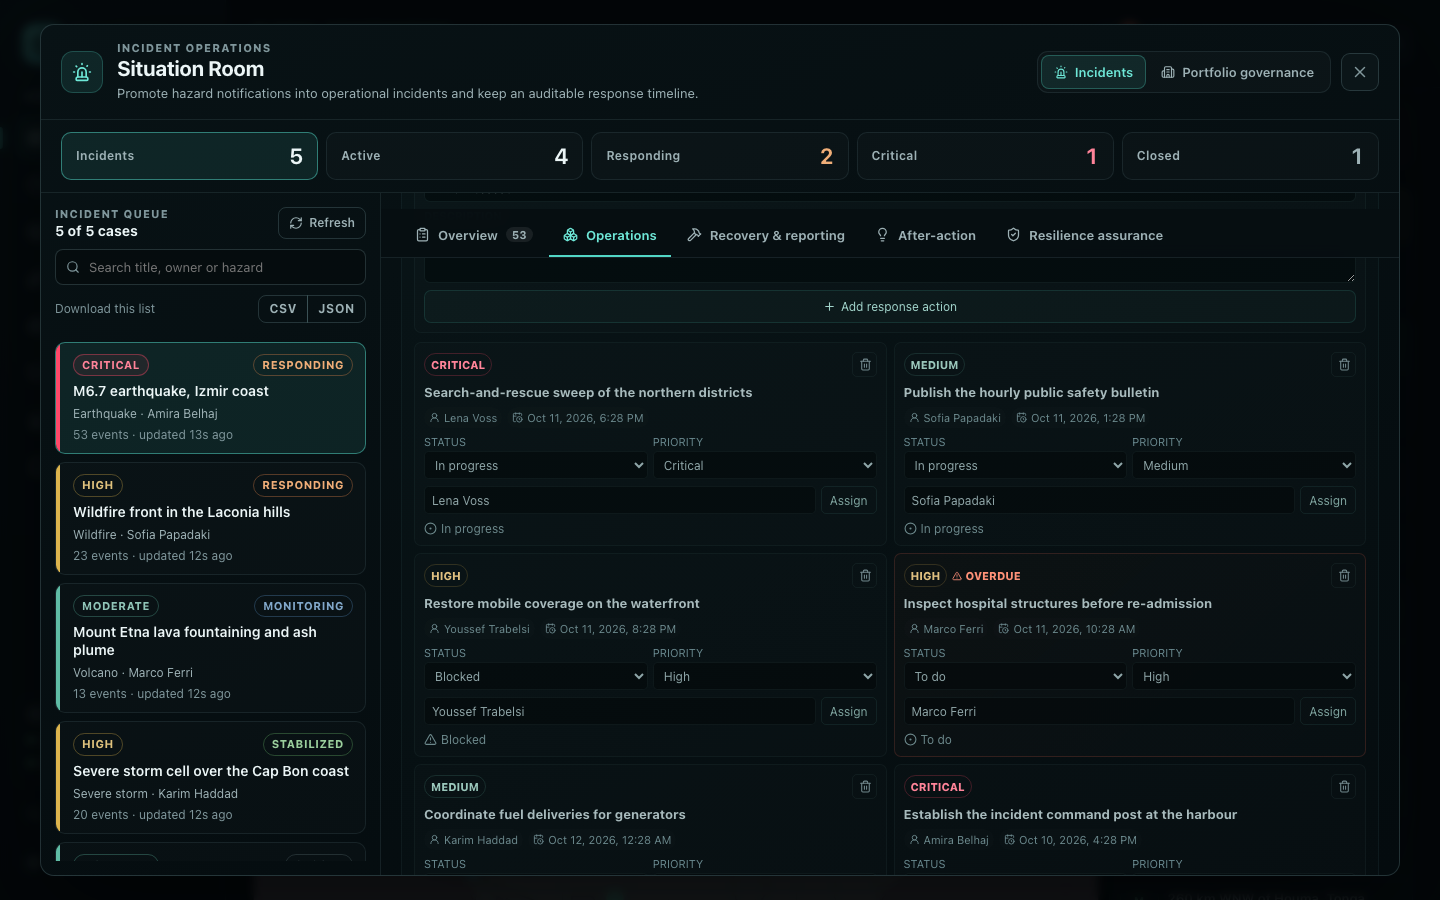
- Response actions, resource requests and allocation, evacuation zones and shelters, and critical lifelines
- Damage assessments with verification and repair progress, and printable situation reports
- Closure readiness, after-action reviews, improvement actions and preparedness exercises
- Portfolio governance with a scorecard, strategic objectives, Ed25519-signed closure certificates and offline verification
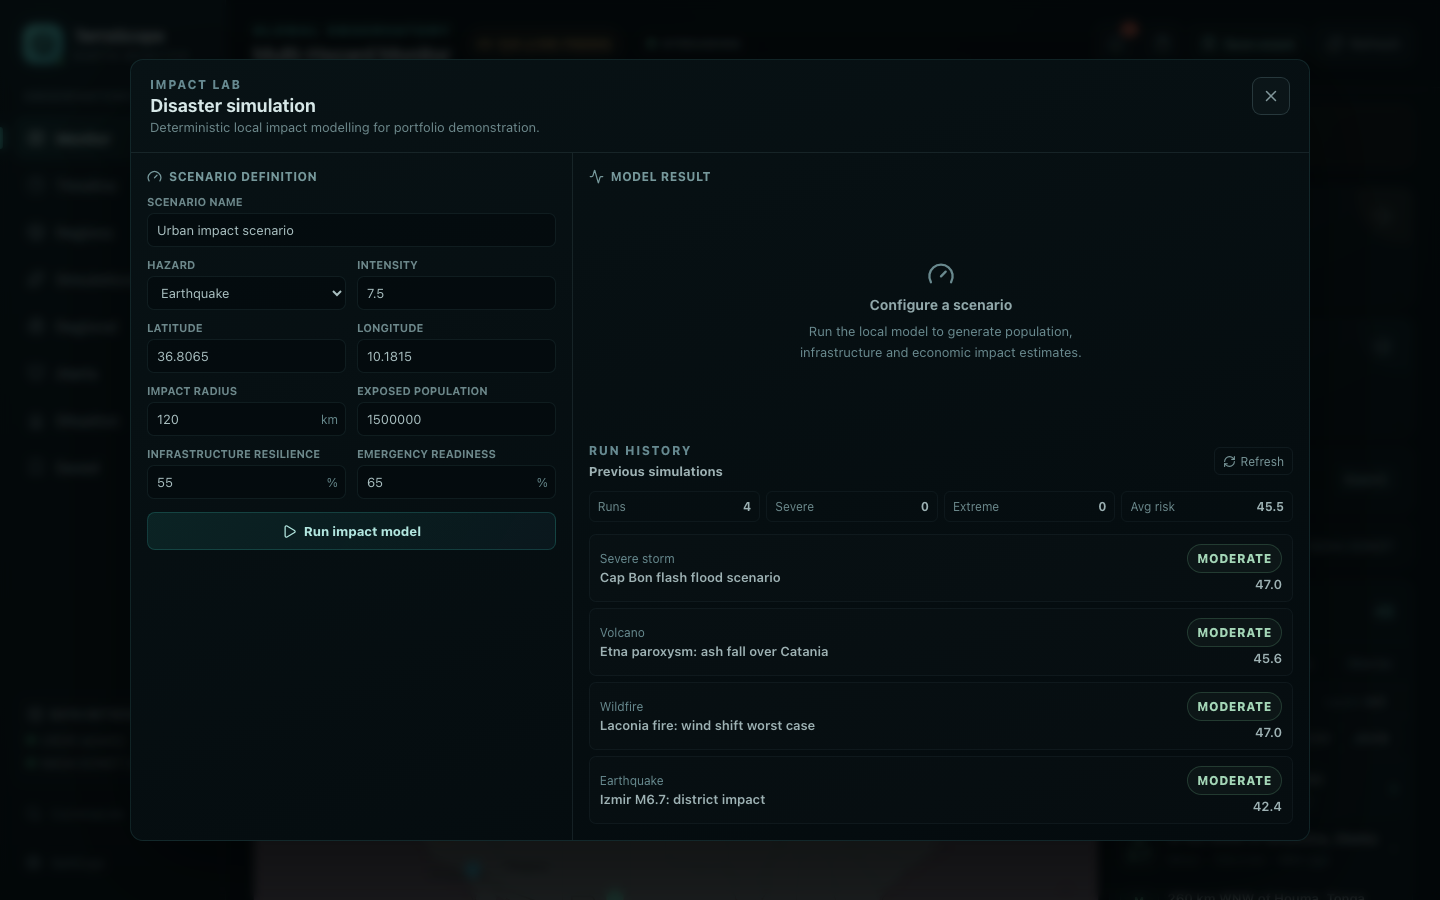
- Impact simulations and regional analysis, with every run kept in a history
- Saved events with a priority from Low to Critical
- Optional sign-in with three roles, an activity log of who changed what, and CSV or JSON export
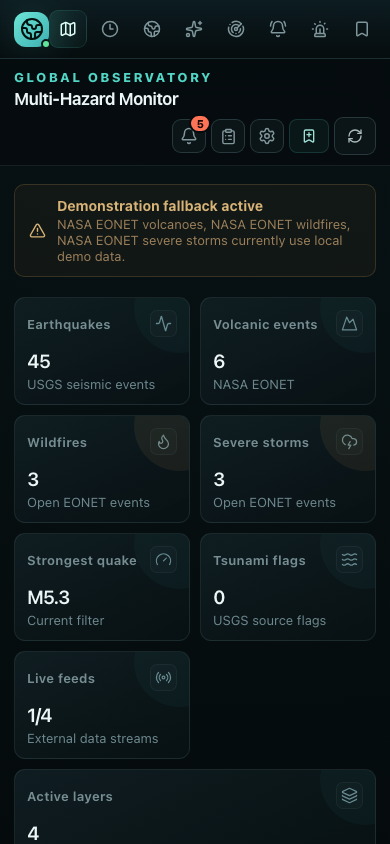
- A command palette, keyboard shortcuts, light and dark themes and a phone layout
Where the engineering is
From a feed to an alert to the screen
Every two minutes, after a 20-second start-up delay, a scheduler fetches the four feeds and turns the events into points. Each point is checked against every enabled rule: the hazard type, the great-circle distance inside the radius and the minimum intensity. A matching event raises one alert per rule and source event, never a duplicate.
New alerts are pushed to the browser over Server-Sent Events, with a keep-alive every 20 seconds. The app shows a toast, updates the notification bell and refreshes what you are looking at, and from the alert center an alert can be acknowledged, dismissed or turned into an incident.
 , Open the full-size image (opens in a new tab)
One place to run an incident
Each incident has an owner, a severity, a status and a full timeline of everything that happened to it. The Situation Room splits the work into tabs: an overview, operations, recovery and reporting, after-action and resilience assurance.
The overview opens with a command pulse that sums up the operational pressure: open and overdue actions, blockers, resource shortages, lifelines down, the population affected and the evacuation backlog, with snapshots over time.
 , Open the full-size image (opens in a new tab)
Estimating the impact of a scenario
An impact simulation takes a hazard, a location, a radius, an intensity, the exposed population, and how resilient the infrastructure and how ready the responders are. It returns the affected and displaced population, an estimated economic loss, a composite risk score and a band from Low to Extreme, and every run is kept in a history.
Regional analysis looks at one area: it counts the hazards inside it, finds the nearest event and gives an activity index from Quiet to Critical. The page says plainly that the index is not an official forecast or emergency risk classification.
 , Open the full-size image (opens in a new tab)
Records that can be checked offline
Governance records can be exported and checked without the app. Receipt ledgers carry the hash of the previous receipt, so an edited or missing entry breaks the chain, and closure certificates are signed with Ed25519.
Three standalone Java tools do the checking: a trust verifier, a checkpoint bundle verifier and a release integrity checker for the verifiers themselves.
Sign-in that is off by default, and strict when on
When sign-in is on, tokens are signed with HMAC-SHA256, passwords are hashed with PBKDF2, and a role policy covers every route and method. The backend refuses to start if the signing secret is missing or shorter than 32 characters.
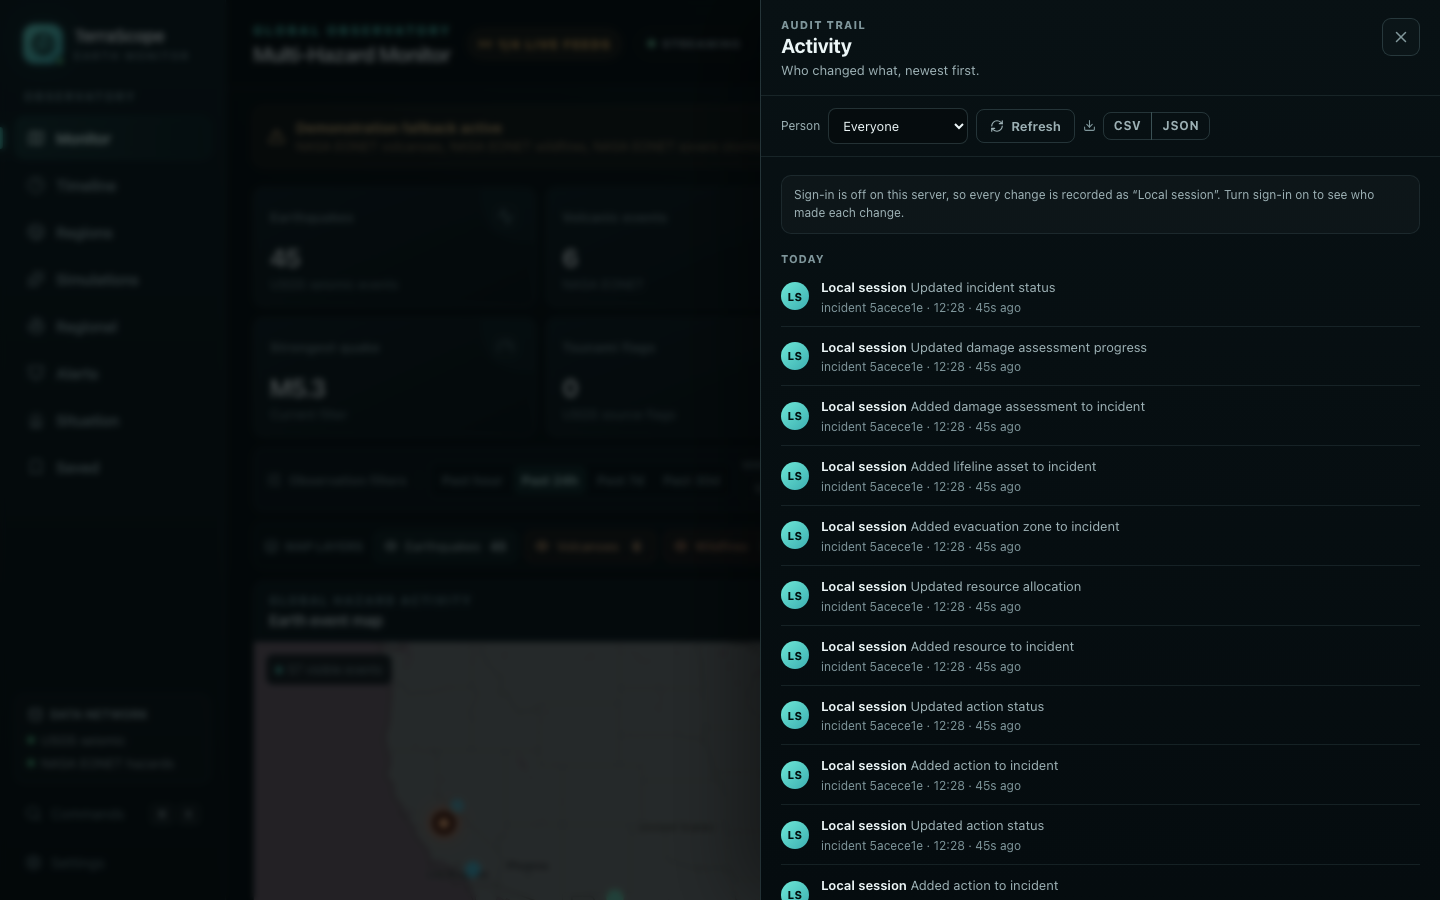
Five failed sign-ins for one username within 15 minutes lock that username for 15 minutes, and the last enabled administrator can't be demoted or disabled. The activity log records every change made by an Operator or Administrator, and old entries are deleted by a nightly retention job.
 , Open the full-size image (opens in a new tab)
Made for daily use
Ctrl+K, or Cmd+K on a Mac, opens a command palette to jump anywhere or run a command, and G then a letter opens a panel from the keyboard. CSV and JSON buttons sit on the event stream, the incident queue, the incident timeline, saved events and the activity log.
The interface is dark by default, with Light and System themes in Settings. The light theme is generated from the dark one by a script, so there is one stylesheet to maintain, printing always uses the light theme, and the layout adapts down to a phone screen.
 , Open the full-size image (opens in a new tab)
Screens
 , Open the full-size image (opens in a new tab)
Response actions, with owners and priorities. 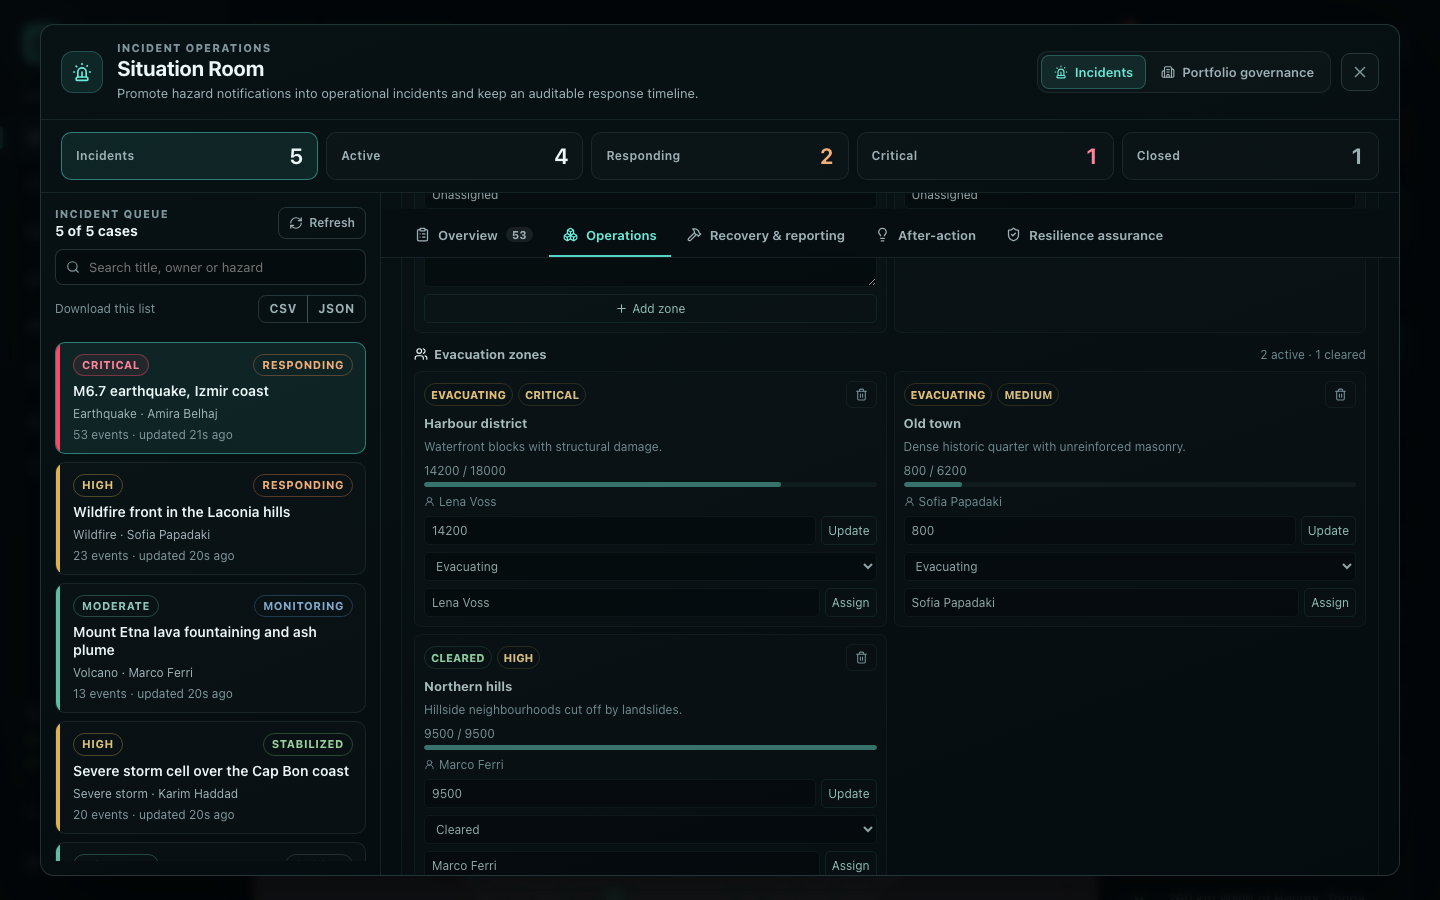 , Open the full-size image (opens in a new tab)
Evacuation zones and shelters. 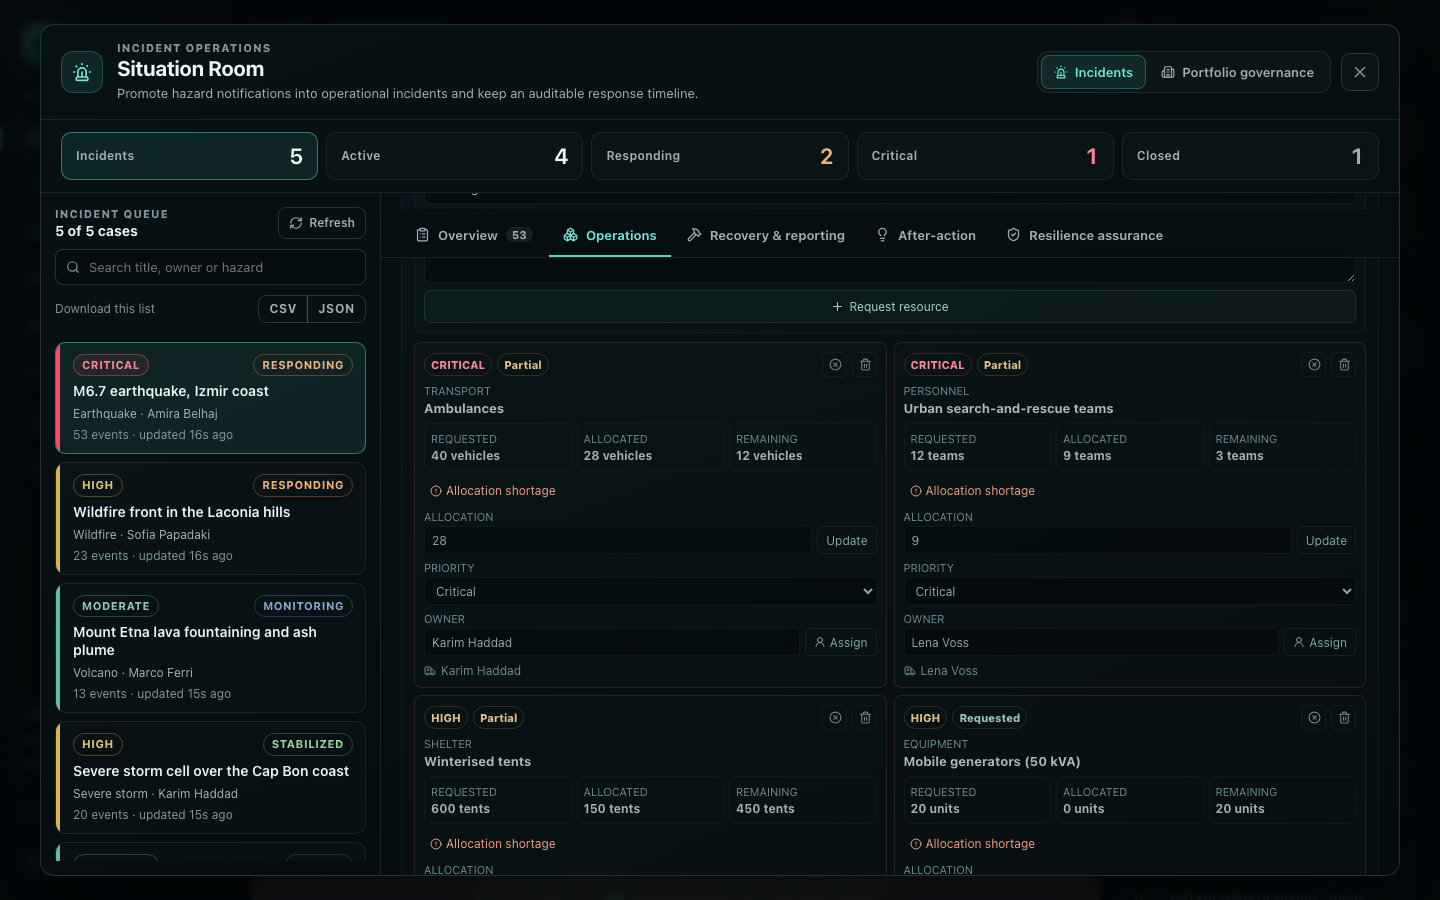 , Open the full-size image (opens in a new tab)
Resource requests, with the shortages marked. 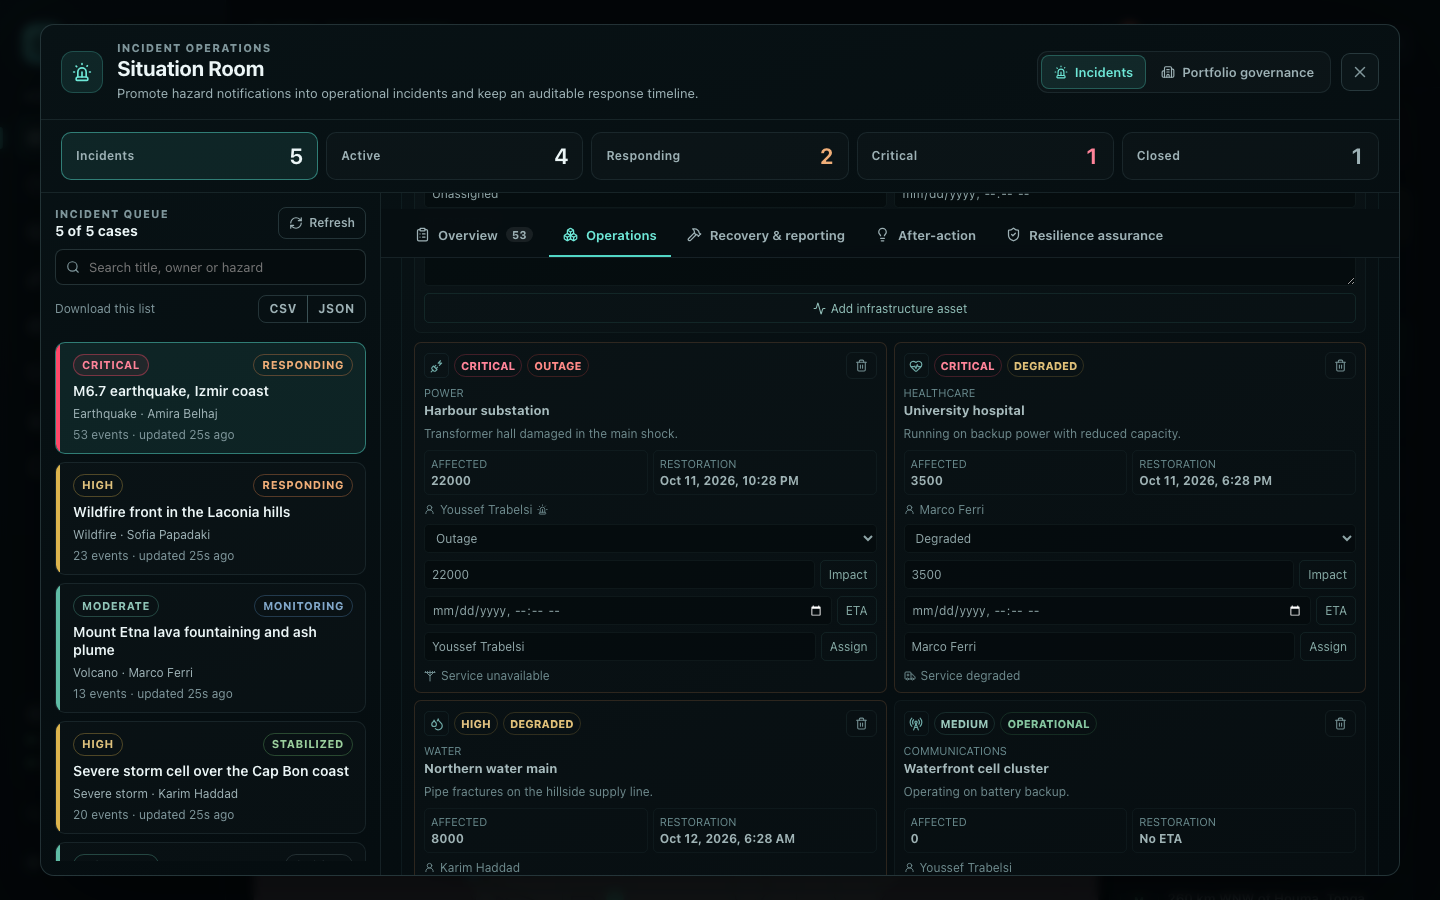 , Open the full-size image (opens in a new tab)
Critical lifelines and when they come back. 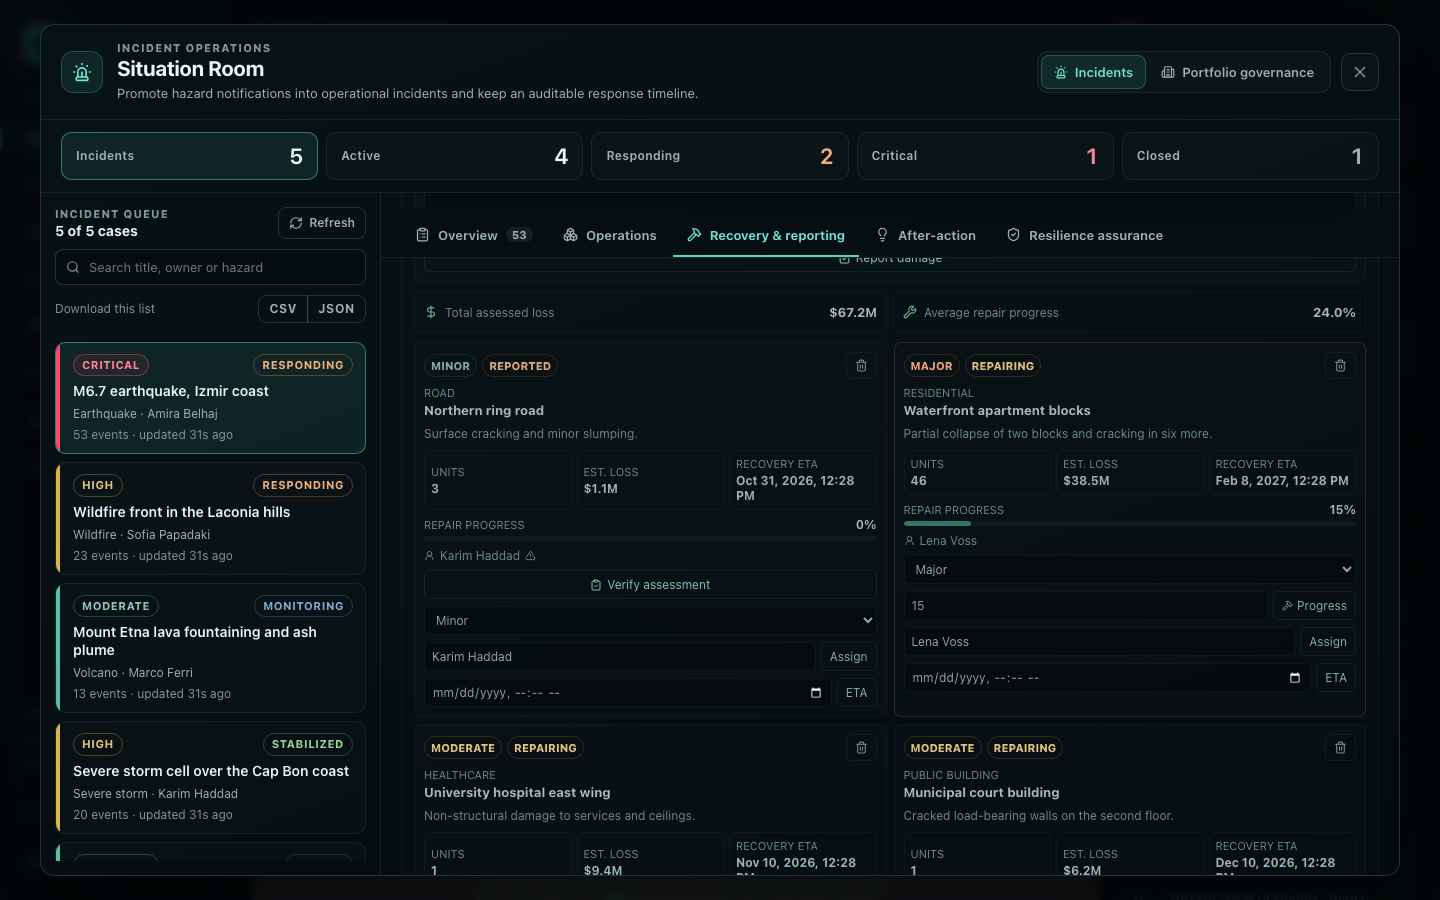 , Open the full-size image (opens in a new tab)
Damage assessments and repair progress. 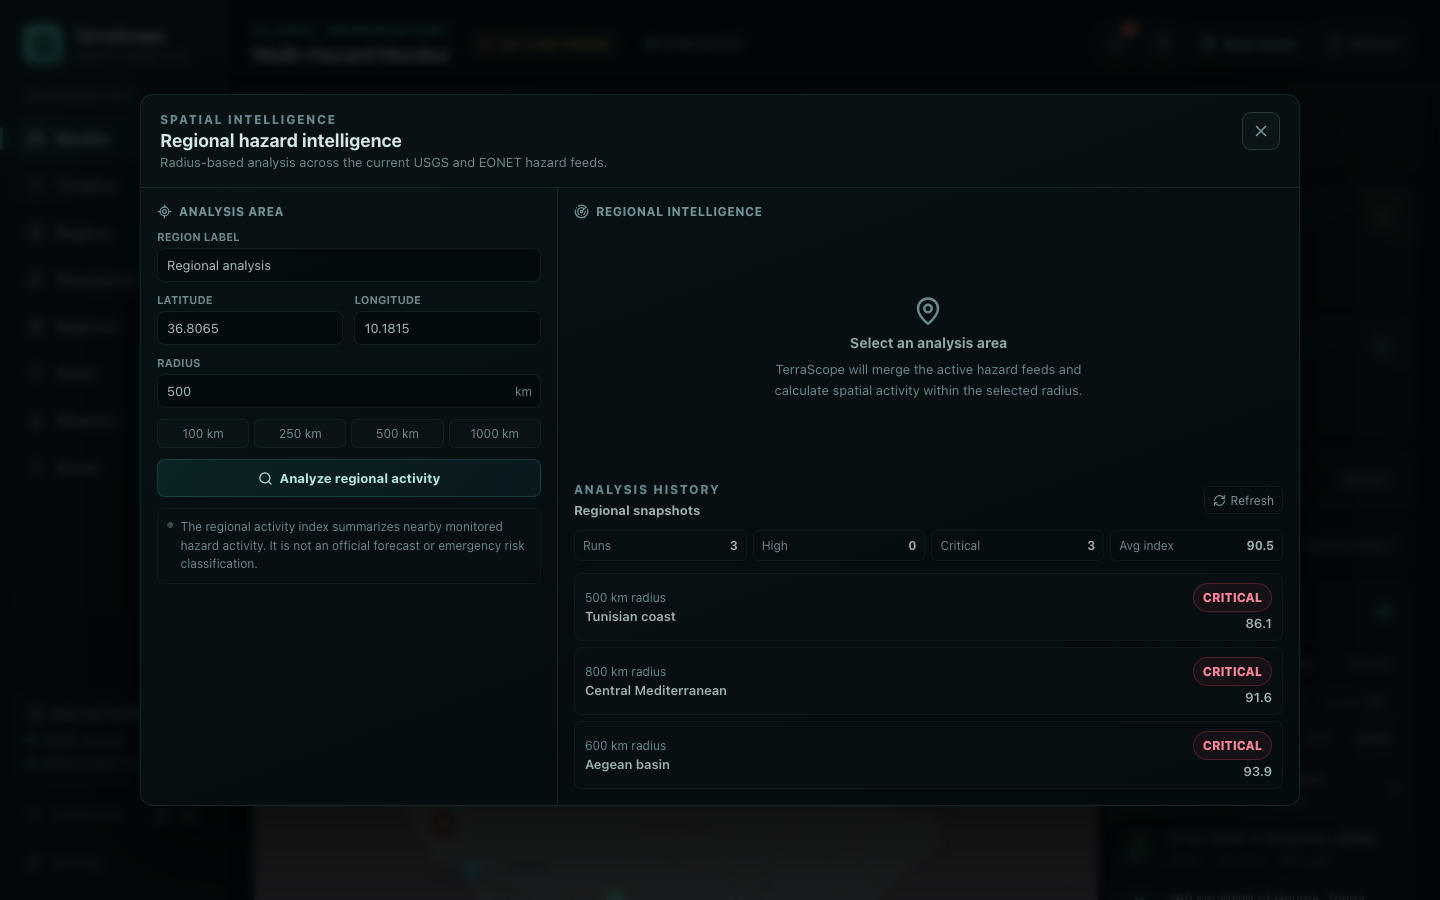 , Open the full-size image (opens in a new tab)
Hazard activity around a chosen area. 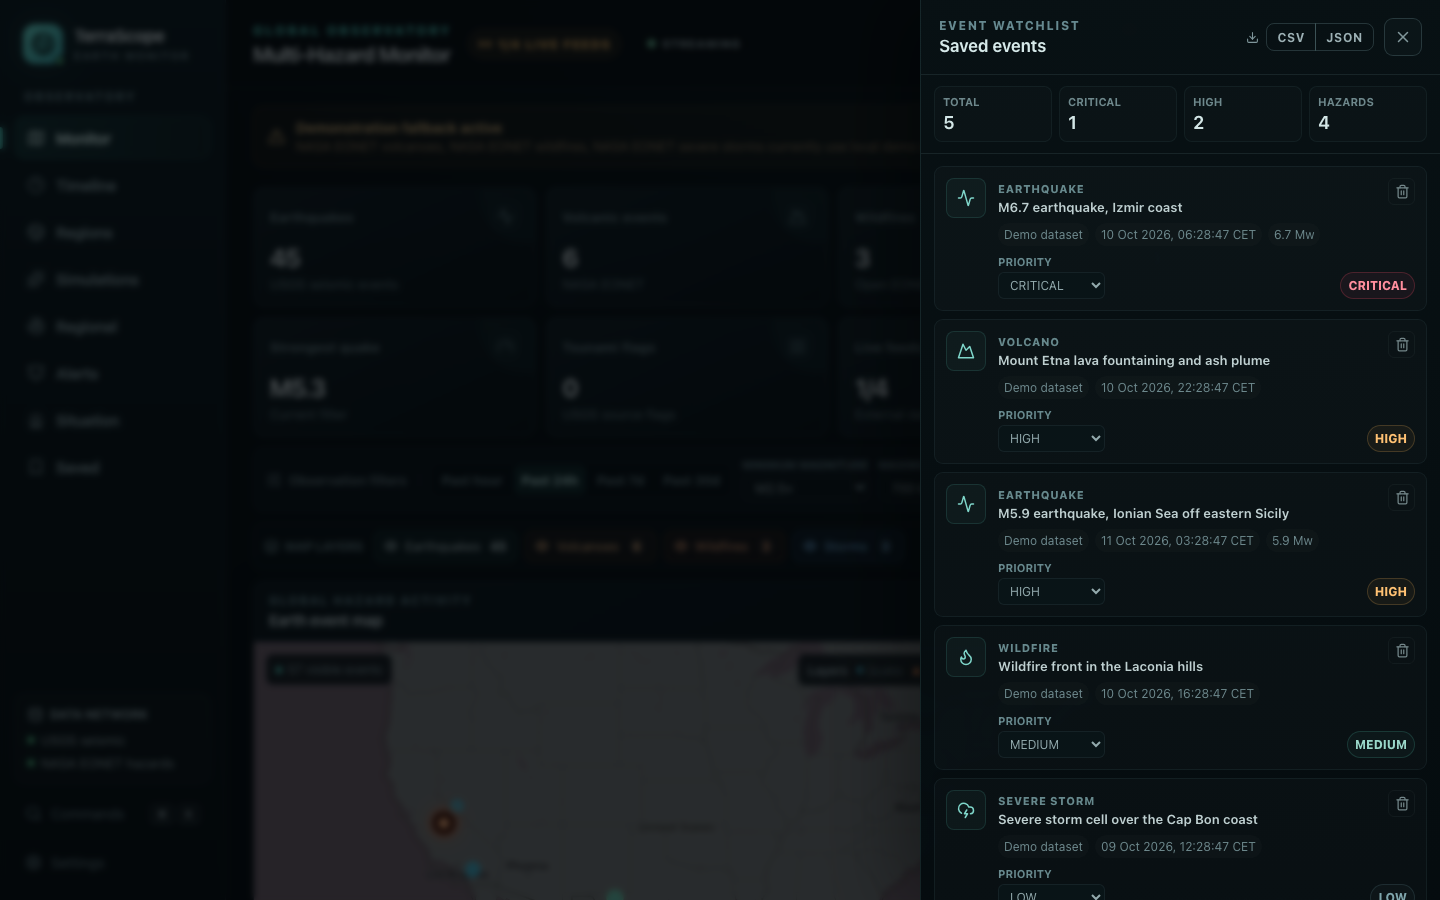 , Open the full-size image (opens in a new tab)
Saved events with priorities. 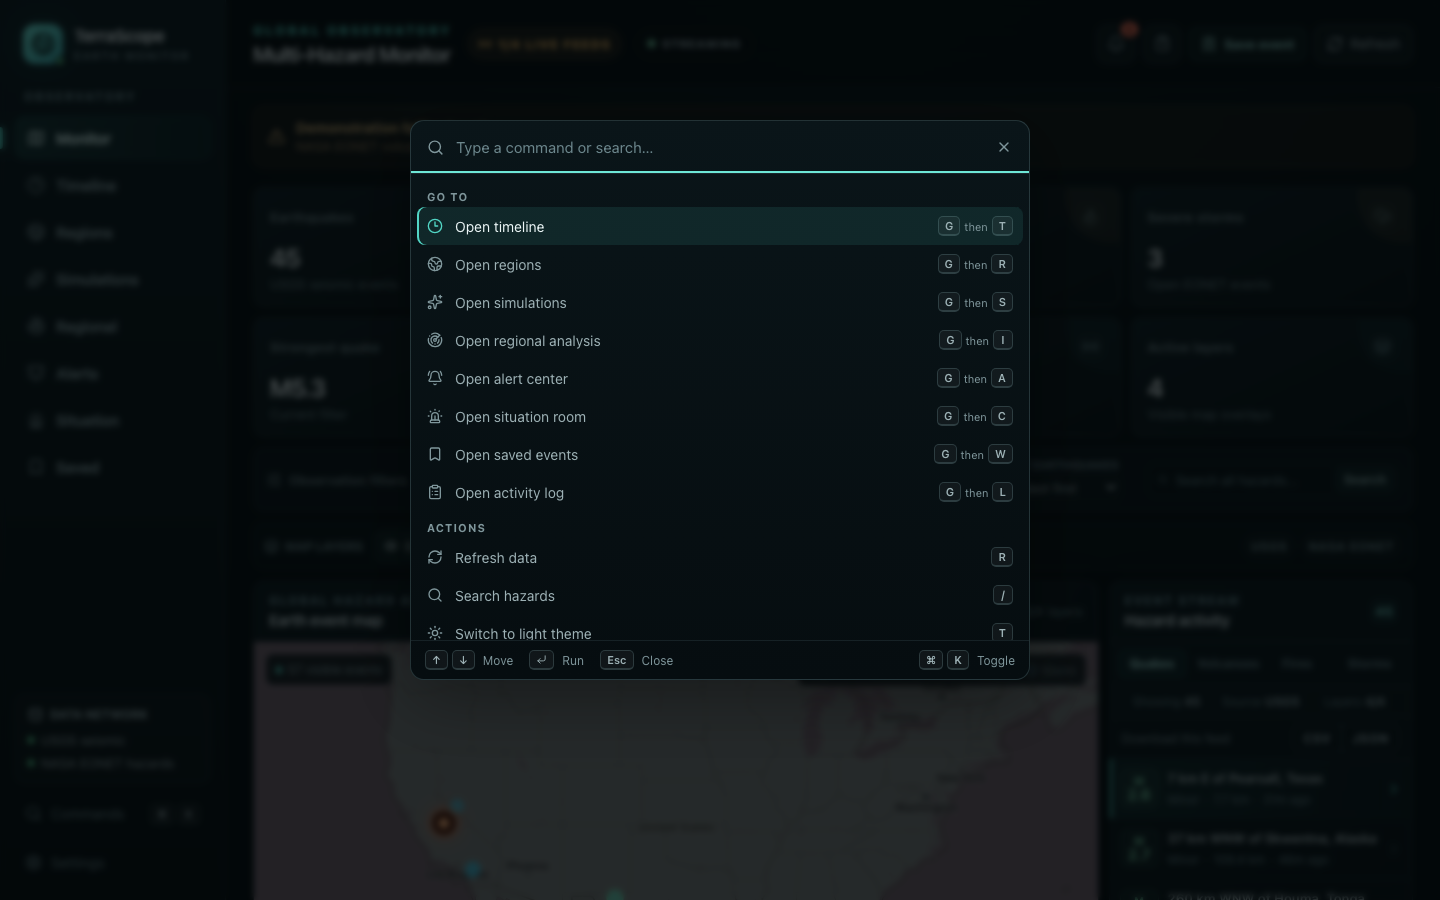 , Open the full-size image (opens in a new tab)
The command palette.
How it's built
| Layer | Technology |
|---|---|
| Backend | Java 21 and Spring Boot 4.1, in layers: api, service, repository, domain, infrastructure, security and activity, with 46 REST controllers |
| Data access | Plain SQL through Spring's JdbcClient, with no ORM, and Bean Validation on the input |
| Database | PostgreSQL 17, with the schema owned by 45 Flyway migrations |
| Web | Next.js 16, React 19 and strict TypeScript, Leaflet on OpenStreetMap tiles, and plain CSS |
| Live data | USGS and NASA EONET feeds fetched on a schedule with a short in-memory cache, and Server-Sent Events to the browser |
| Packaging | Docker Compose, with multi-stage images that run as a non-root user, started with one command |
Testing
The backend ships with a test suite, and the web app has lint and type checks. A long end-to-end script runs the backend tests, the build, the schema and the release tools of the verifiers.
A Playwright script takes real screenshots of a running app with the demo data loaded, and skips the map screens instead of saving an empty map when the tiles don't load. The demo seed is safe to run twice: anything that already exists is left alone, and it fills in whatever a failed run missed.
Results
- Live data from four hazard feeds: earthquakes, volcanoes, wildfires and severe storms.
- 46 REST controllers over a schema of 45 Flyway migrations.
- One command starts the database, the API and the web app, with optional sign-in and demo data.
- Governance records that can be verified offline with three standalone tools.
Built with
- Java
- Spring Boot
- PostgreSQL
- Flyway
- Next.js
- React
- TypeScript
- Leaflet
- Docker