- Web
BuildSight
A project-controls platform for construction that tells site teams which projects are slipping, why, and what recovering them would cost, in plain-language answers instead of dashboards full of numbers.
- Personal project, full-stack
- 126 routes, more than 80 feature pages
- Every route audited at desktop and phone width
- Java, Spring Boot, PostgreSQL, Flyway, Next.js, React, TypeScript, Playwright
The problem
On a construction project the schedule lives in one tool, costs in another, risks in a register, safety in a log and paperwork in a shared drive. They rarely agree, and nobody has time to reconcile them before Monday's meeting. By the time a delay shows up in a report, the cheap ways to recover from it are gone.
The approach
I built the product around questions, not charts. Each page is titled with a question a site manager would really ask, such as "How sure is the finish date?", "Can the risk register be trusted?" or "Do the payment certificates add up?", and opens with two or three sentences on how to read it. That rule keeps each page focused and makes the numbers easy to challenge.
Two ideas run through everything. Show whether the data can be trusted before showing what it says: a family of pages reconciles one record against another, such as payment certificates against their own arithmetic, daily production against package totals, deployed crews against reported hours and equipment logs against plant hours. And never show a number that could mislead: no NaN, no Infinity, no 1970 dates, no runaway percentages and no raw codes such as AT_RISK.
What it does
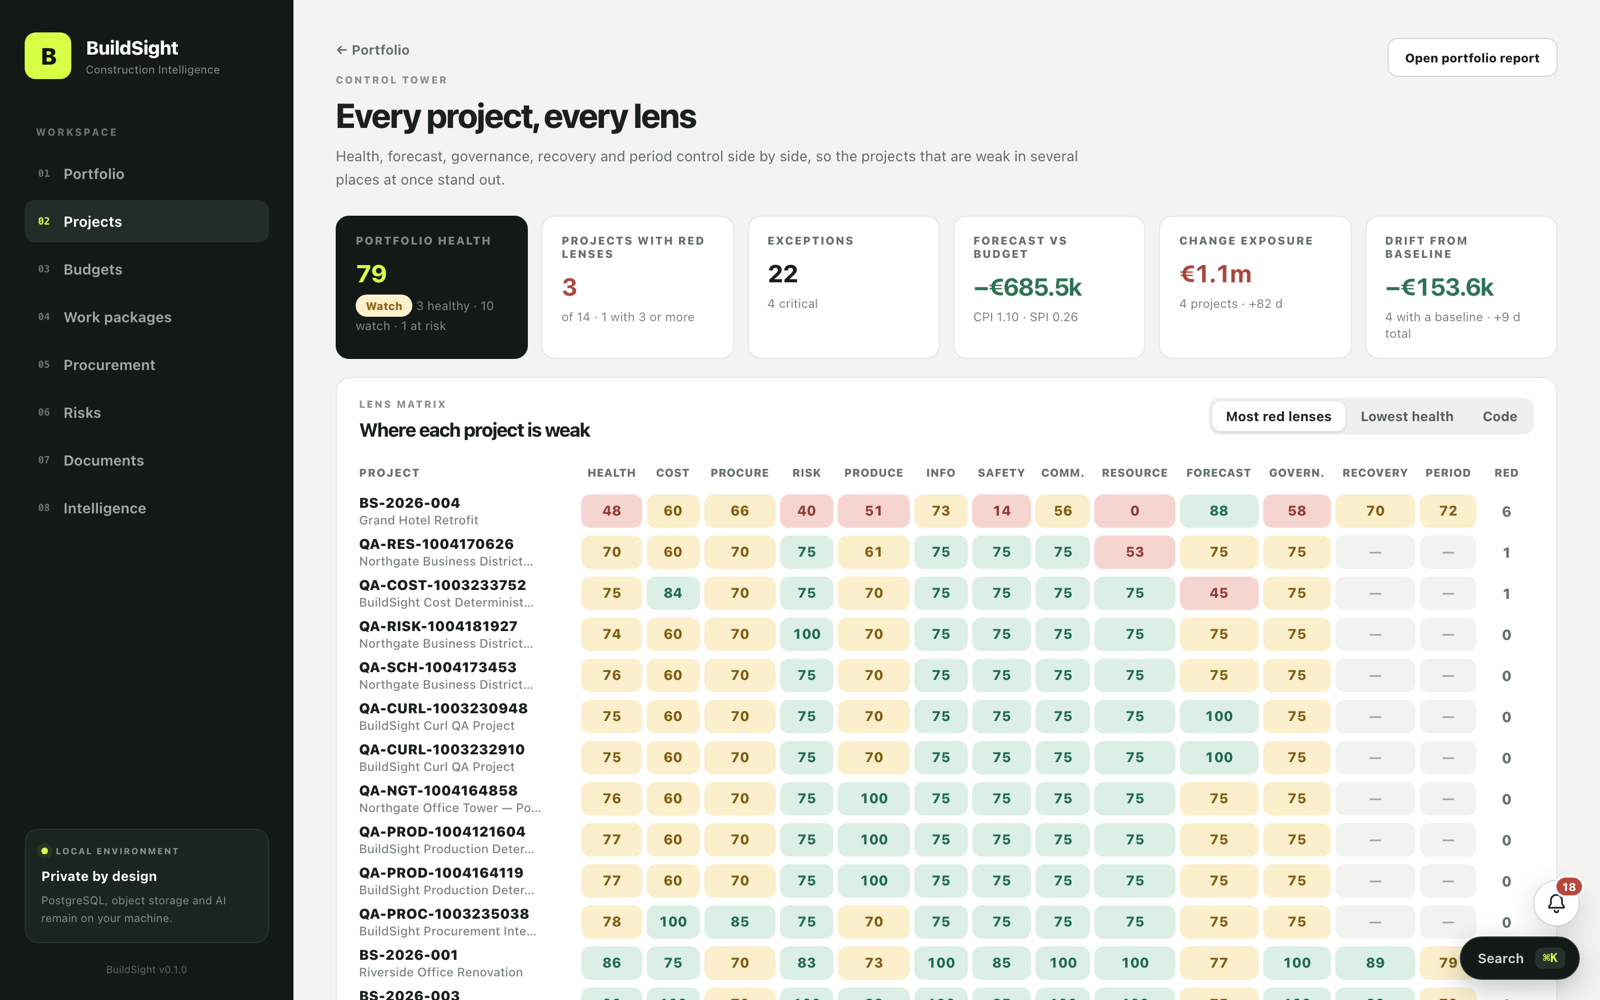
- A portfolio control tower, forecast, recovery plan, governance and period control across every project
- Schedule and forecast pages: progress curve, finish simulation, slip explorer, pinch points and forecast drift
- Recovery options ranked by cost, days recovered and net recovery cost, backed by a change-impact simulation
- Cost and commercial checks: cash position, budget movement, valuations and payment certificates
- A procurement pipeline and supplier board that explains when a package did not go to the lowest bid
- Production and resources: labour burn, crew and equipment reconciliation and a resource heatmap
- Quality, safety and permits: NCRs, inspections, incident rates and clashing permitted jobs
- Risk register health, recurring trouble spots, a Pareto view, a risk board and a risk matrix
- A meeting pack with the agenda already filled in, and an executive status report
- Document control and handover: revisions, transmittals, RFIs and handover dates
- Everyday tools: an inbox, search, a deadline calendar, a watchlist, data health, export and a drag-and-drop action board
Where the engineering is
From a slipping forecast to a costed recovery plan
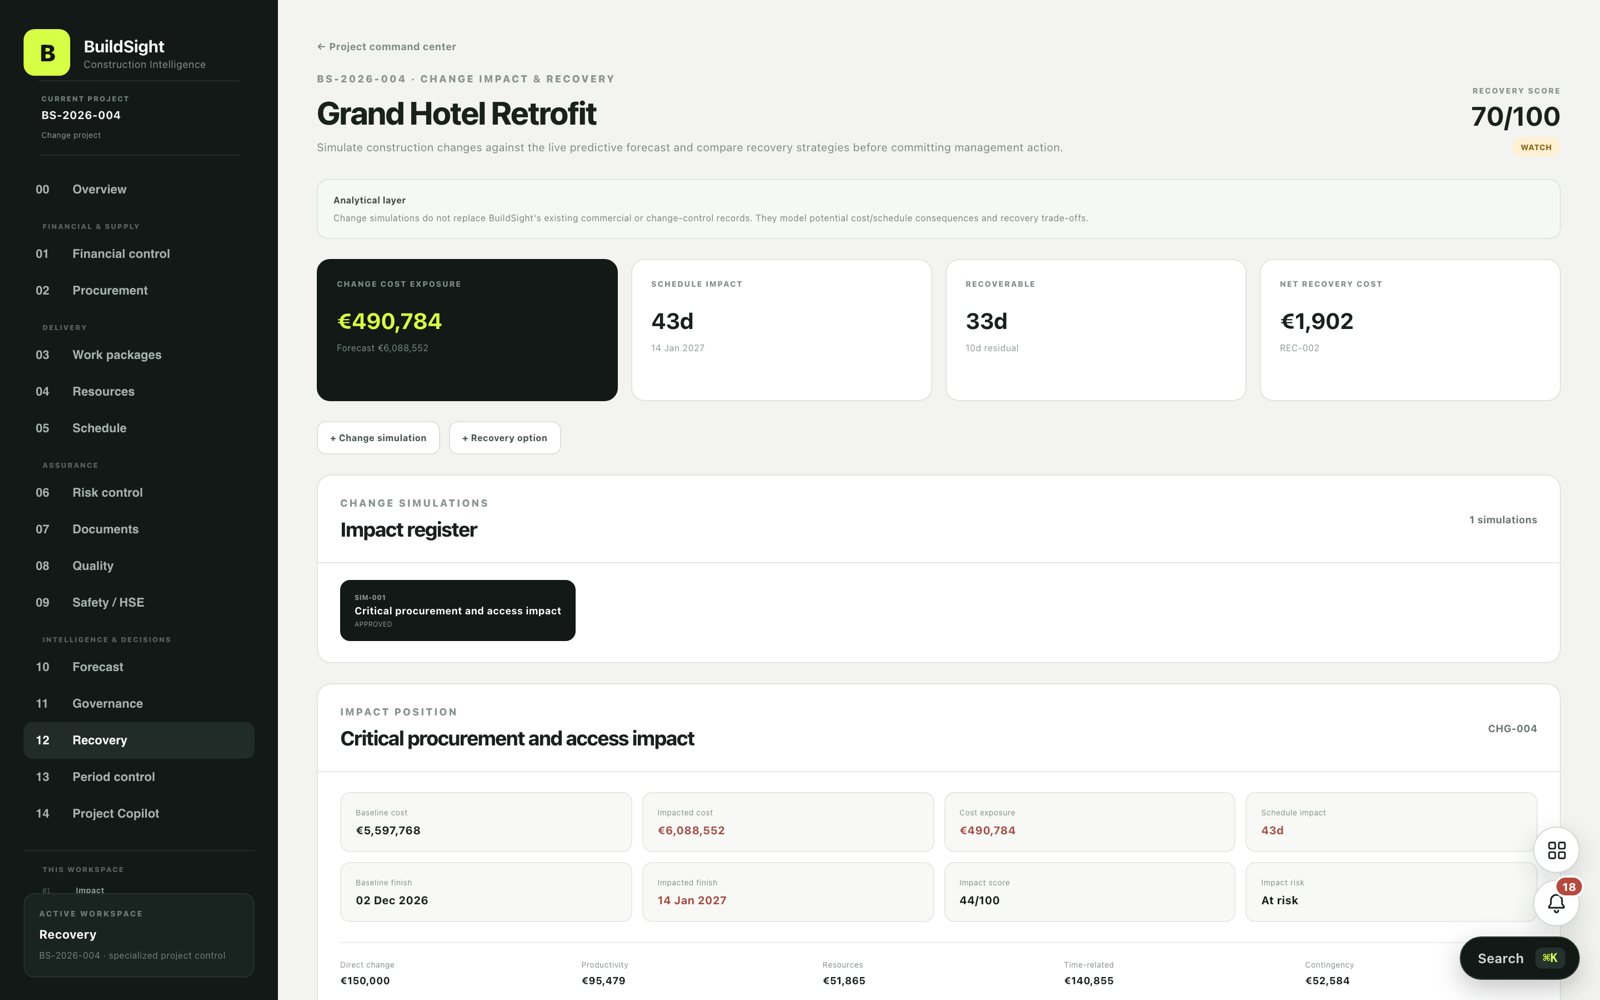
The forecast says how sure the finish date is and how it has been moving. When a project slips, the recovery page ranks the options by cost, days recovered and net recovery cost, and the portfolio view rolls them up across every project.
The calculation engines live in the Spring Boot service layer, including the change-impact simulation behind the recovery options and the portfolio roll-ups.
 , Open the full-size image (opens in a new tab)
A recovery cost that is negative
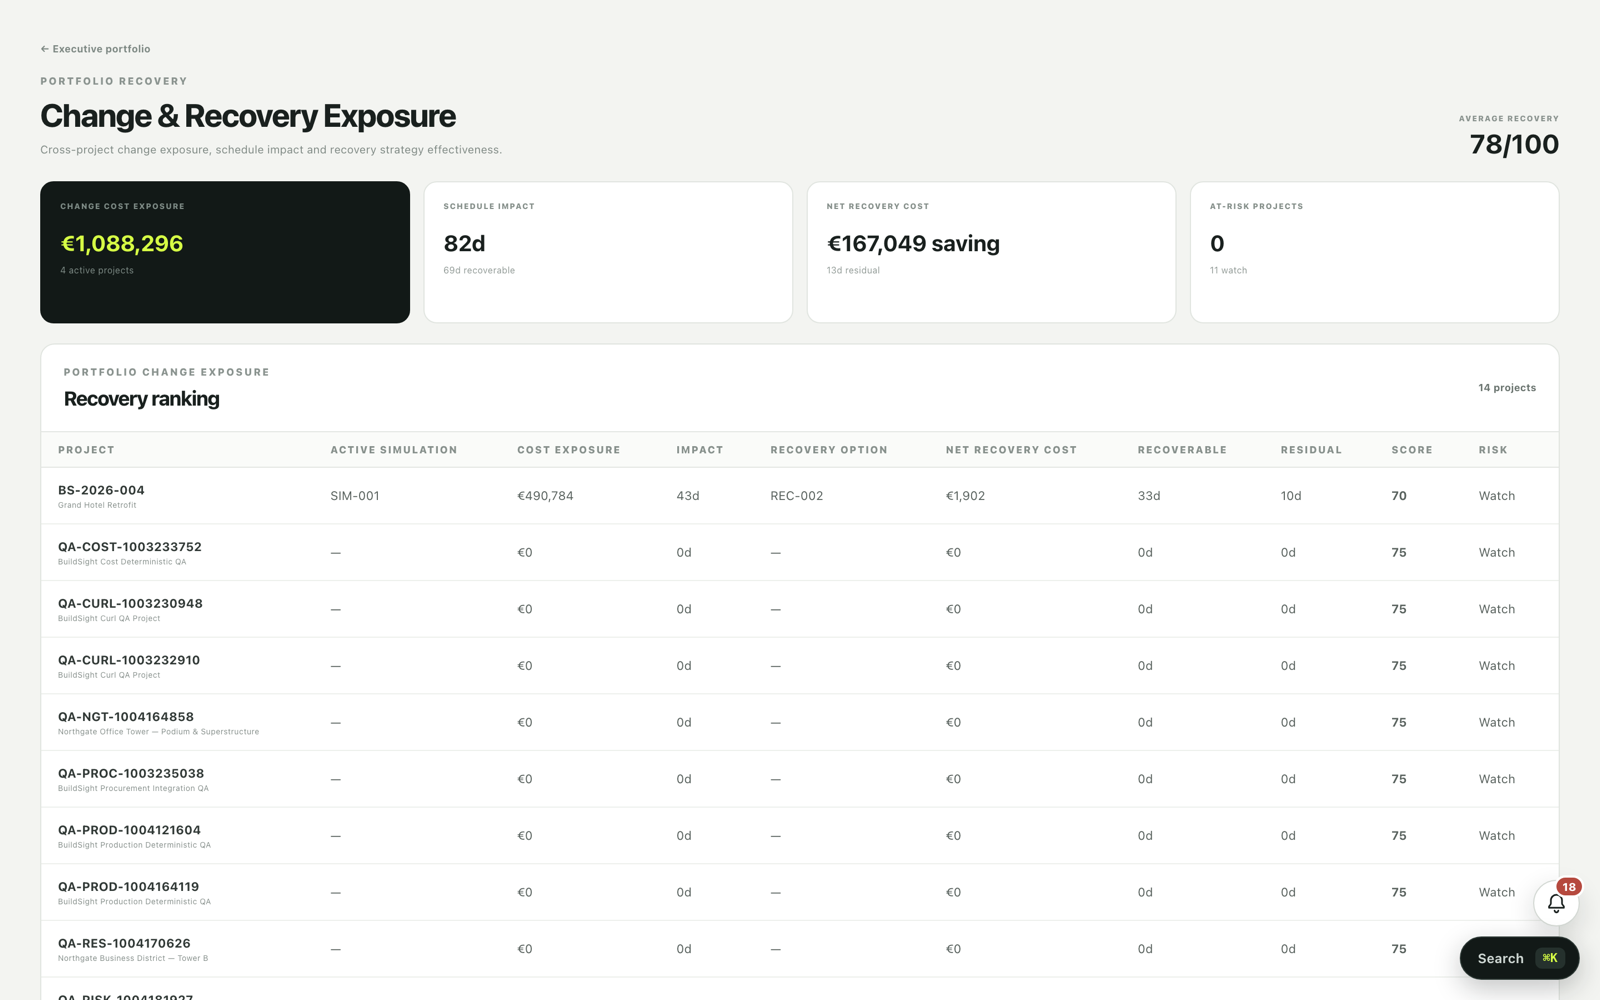
The audit flagged a negative recovery cost of about -167,000 across the portfolio. It was not a bug: a recovery option costs money, but the days it recovers save time-related costs, and sometimes the savings win.
Rather than hide it, I relabelled the figure "net recovery cost" and show a negative as a saving, with a tooltip that explains the arithmetic. A number that looks wrong is sometimes right, and the fix is clearer wording.
 , Open the full-size image (opens in a new tab)
Making wrong numbers impossible to ship
Checking 126 pages by hand does not scale, so I wrote a read-only Playwright audit that opens each page in a real browser, at desktop and phone width, and fails it for the things a person would call broken: script errors, failed API calls, NaN or Infinity, empty default dates, raw backend codes, absurd percentages and sideways scrolling.
Its first runs found percentages such as 137,629% on two reconciliation pages, ten pages printing raw codes such as AT_RISK, and a board page that scrolled sideways on a phone. I fixed each at the source: percentages capped as ">999%", a shared label helper and a one-line CSS change.
A phone-width bug caused by invisible text
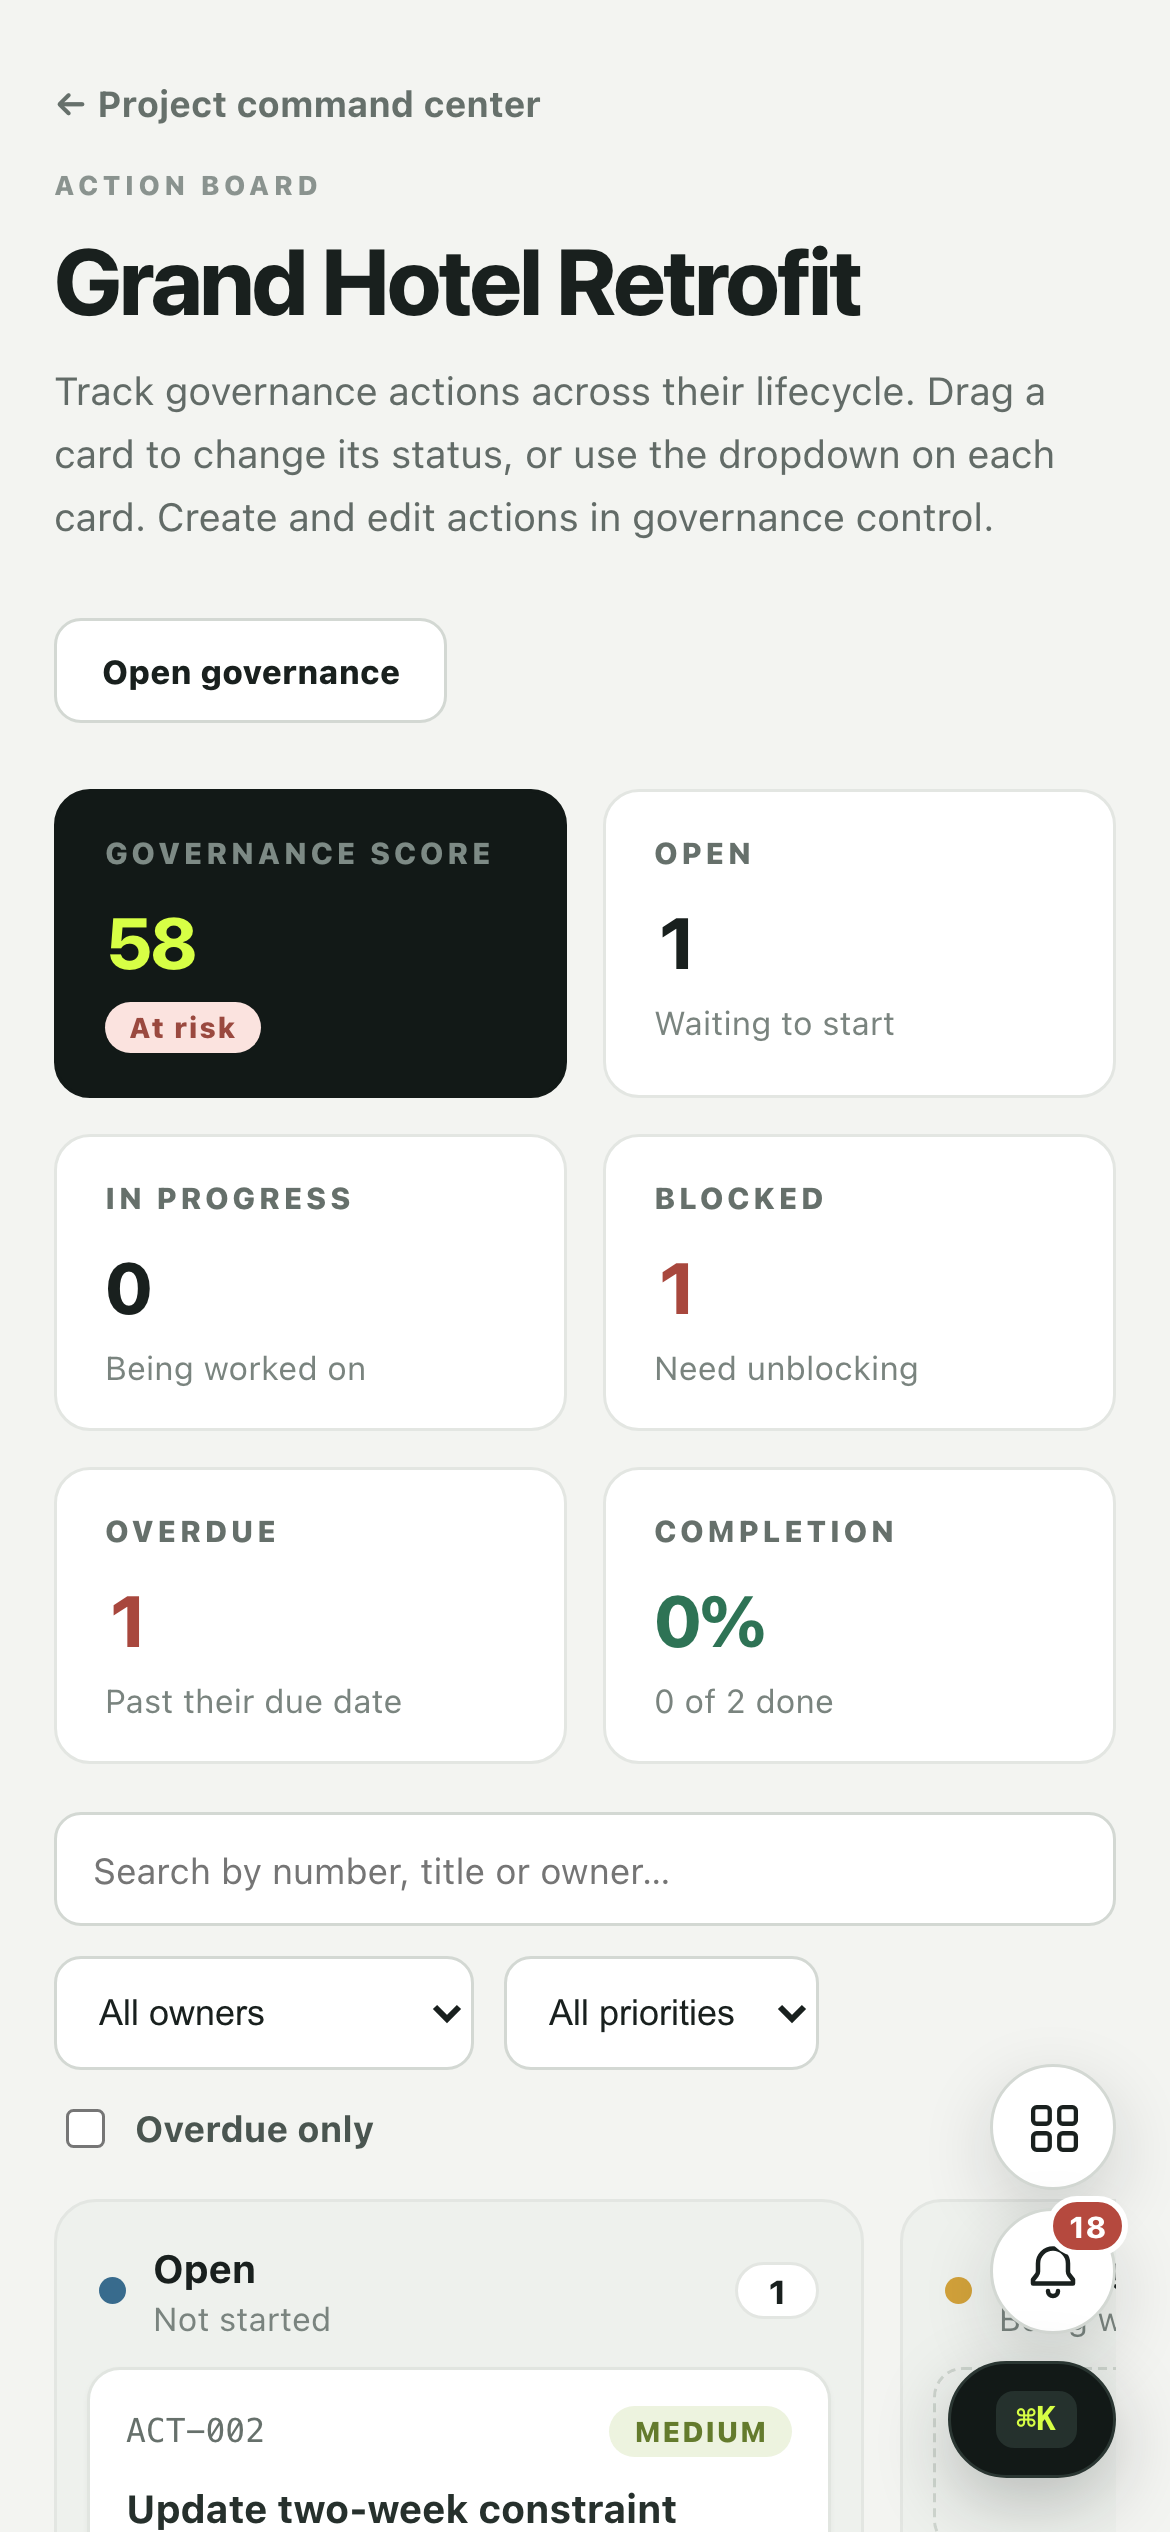
On the action board, the page was 218 px too wide on a phone. The audit narrowed it to a screen-reader-only label inside a column that was scrolled out of view. The board scrolled sideways but was not a positioned box, so the hidden label escaped its scroll area and stretched the whole page. Adding position: relative to the board contained it.
Early versions of the audit also flagged helpful notices and legitimate negative figures as faults. I refined the rules until a warning meant "look at this", which is what makes people trust a checker.
 , Open the full-size image (opens in a new tab)
Screens
 , Open the full-size image (opens in a new tab)
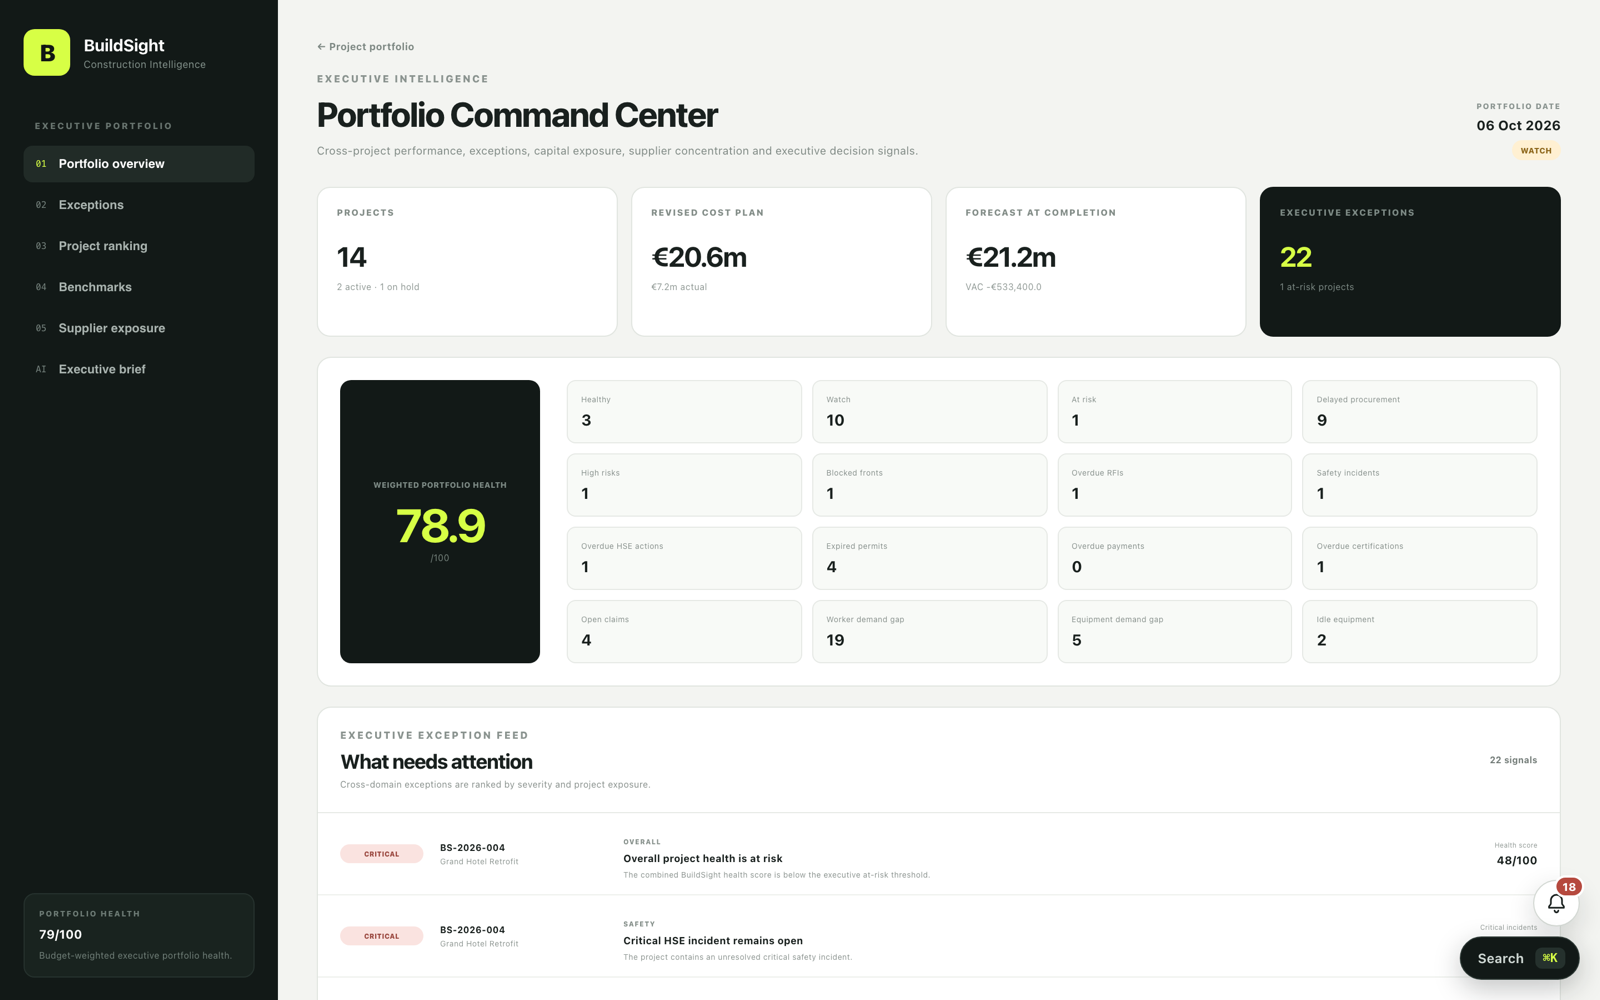
Every project, every lens: the portfolio control tower. 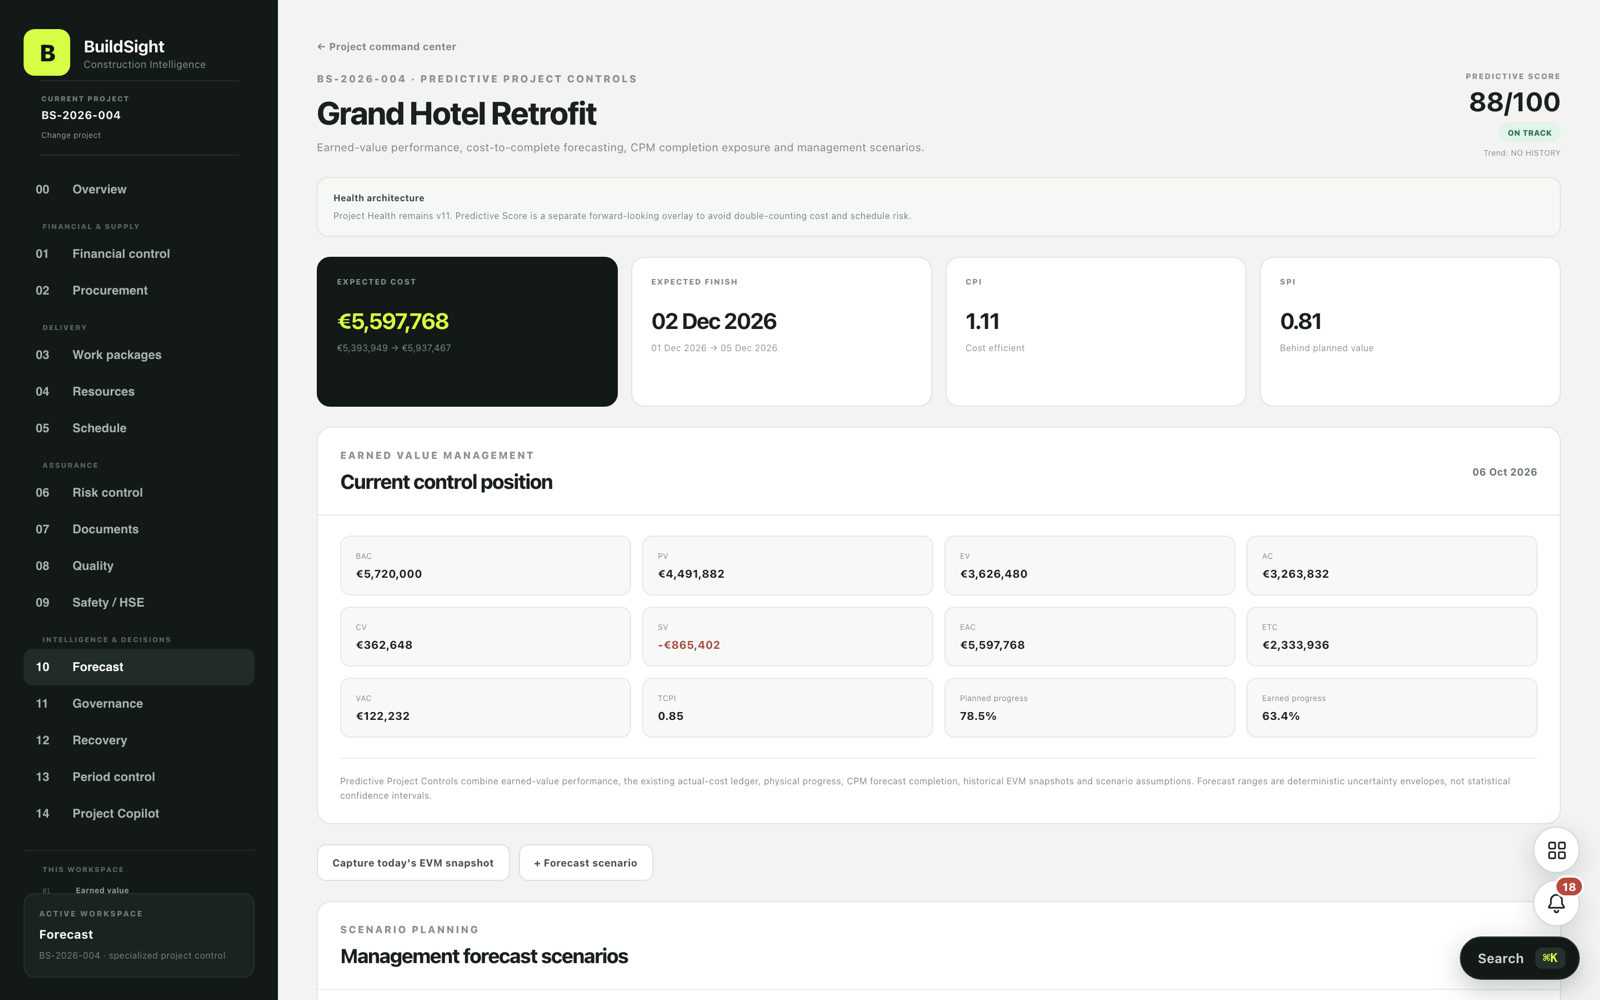 , Open the full-size image (opens in a new tab)
A project's forecast, with expected cost and finish date. 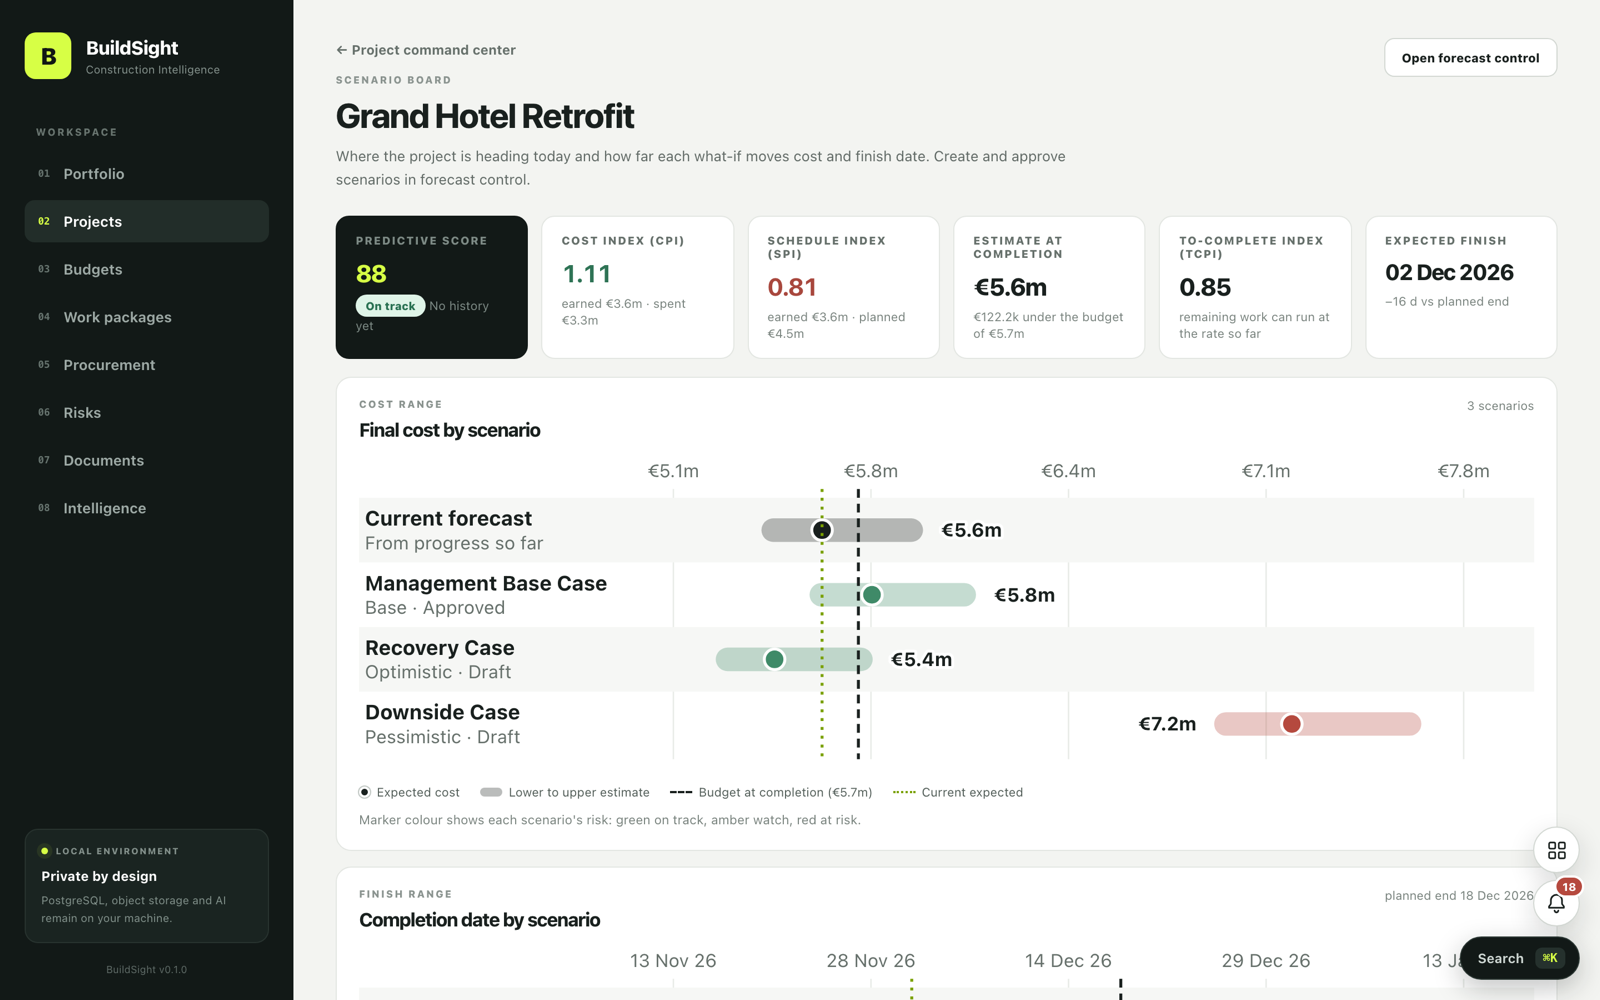 , Open the full-size image (opens in a new tab)
Final cost and finish date by scenario. 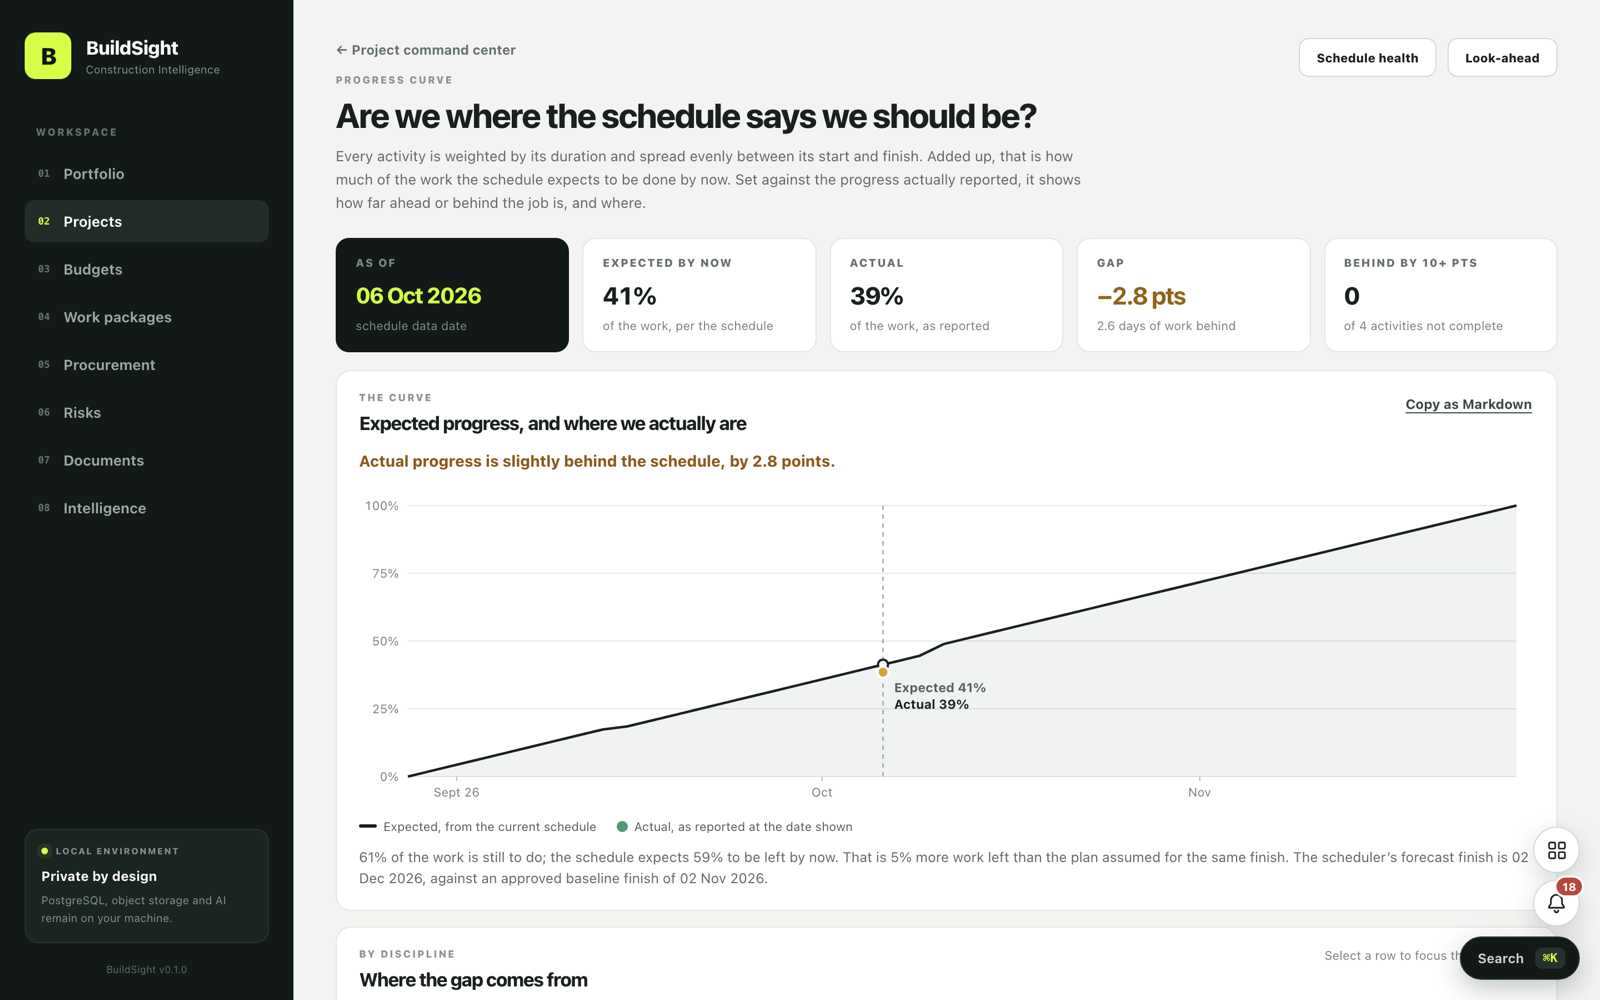 , Open the full-size image (opens in a new tab)
Are we where the schedule says we should be? 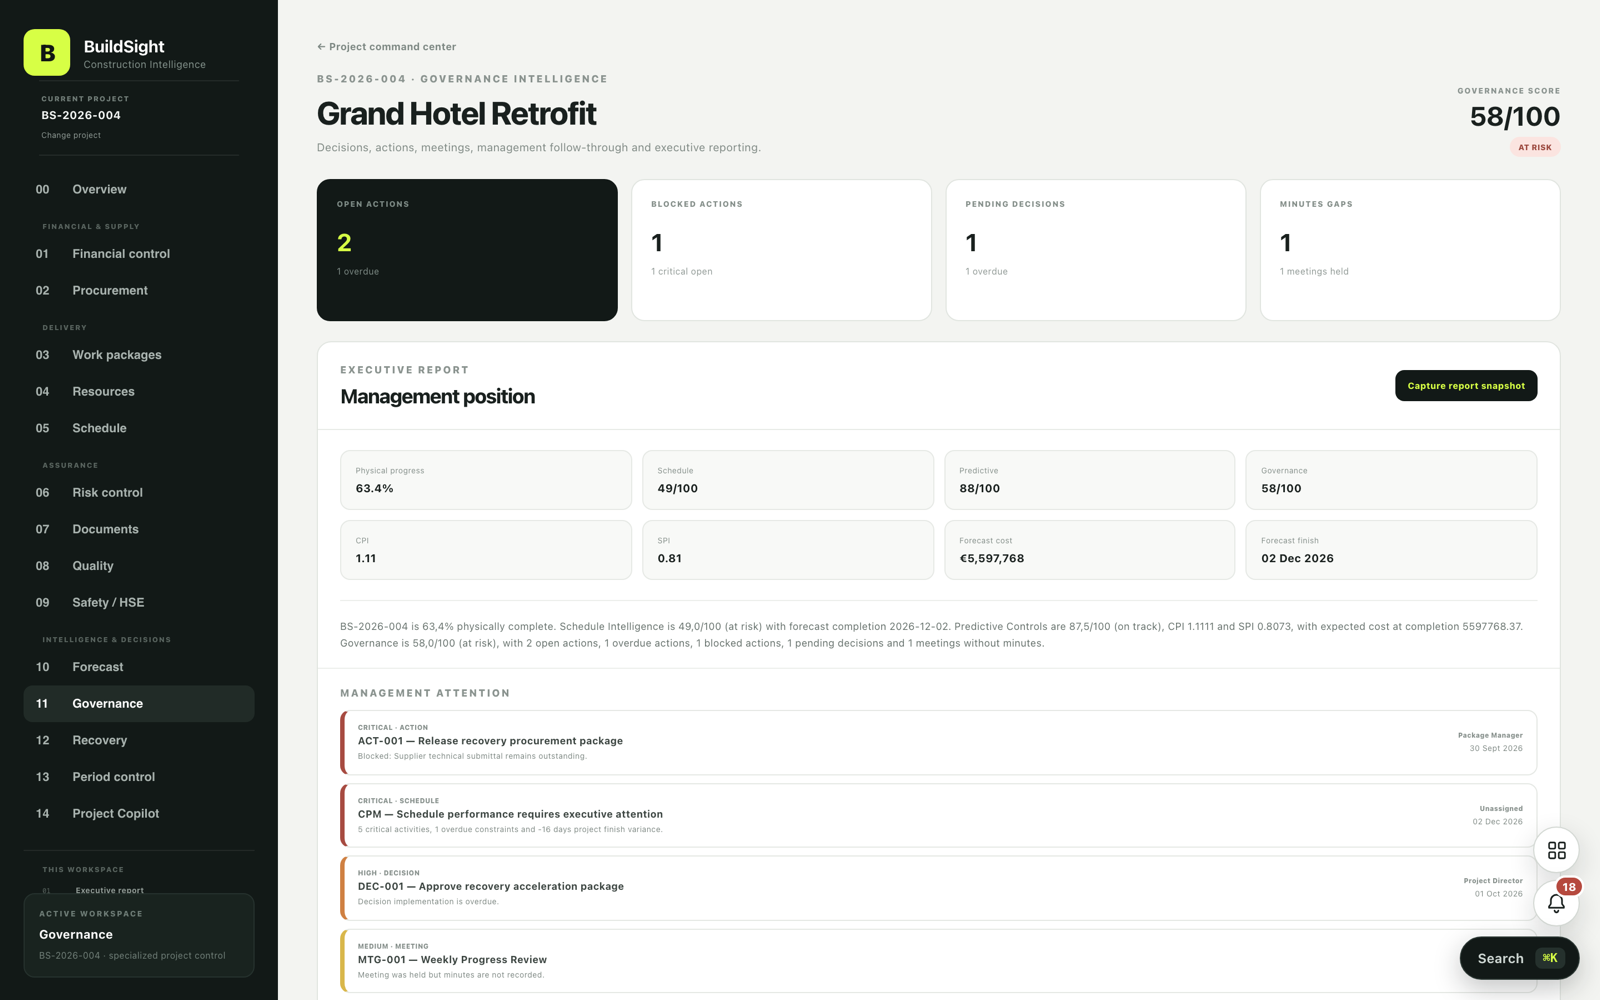 , Open the full-size image (opens in a new tab)
Governance and the executive status report. 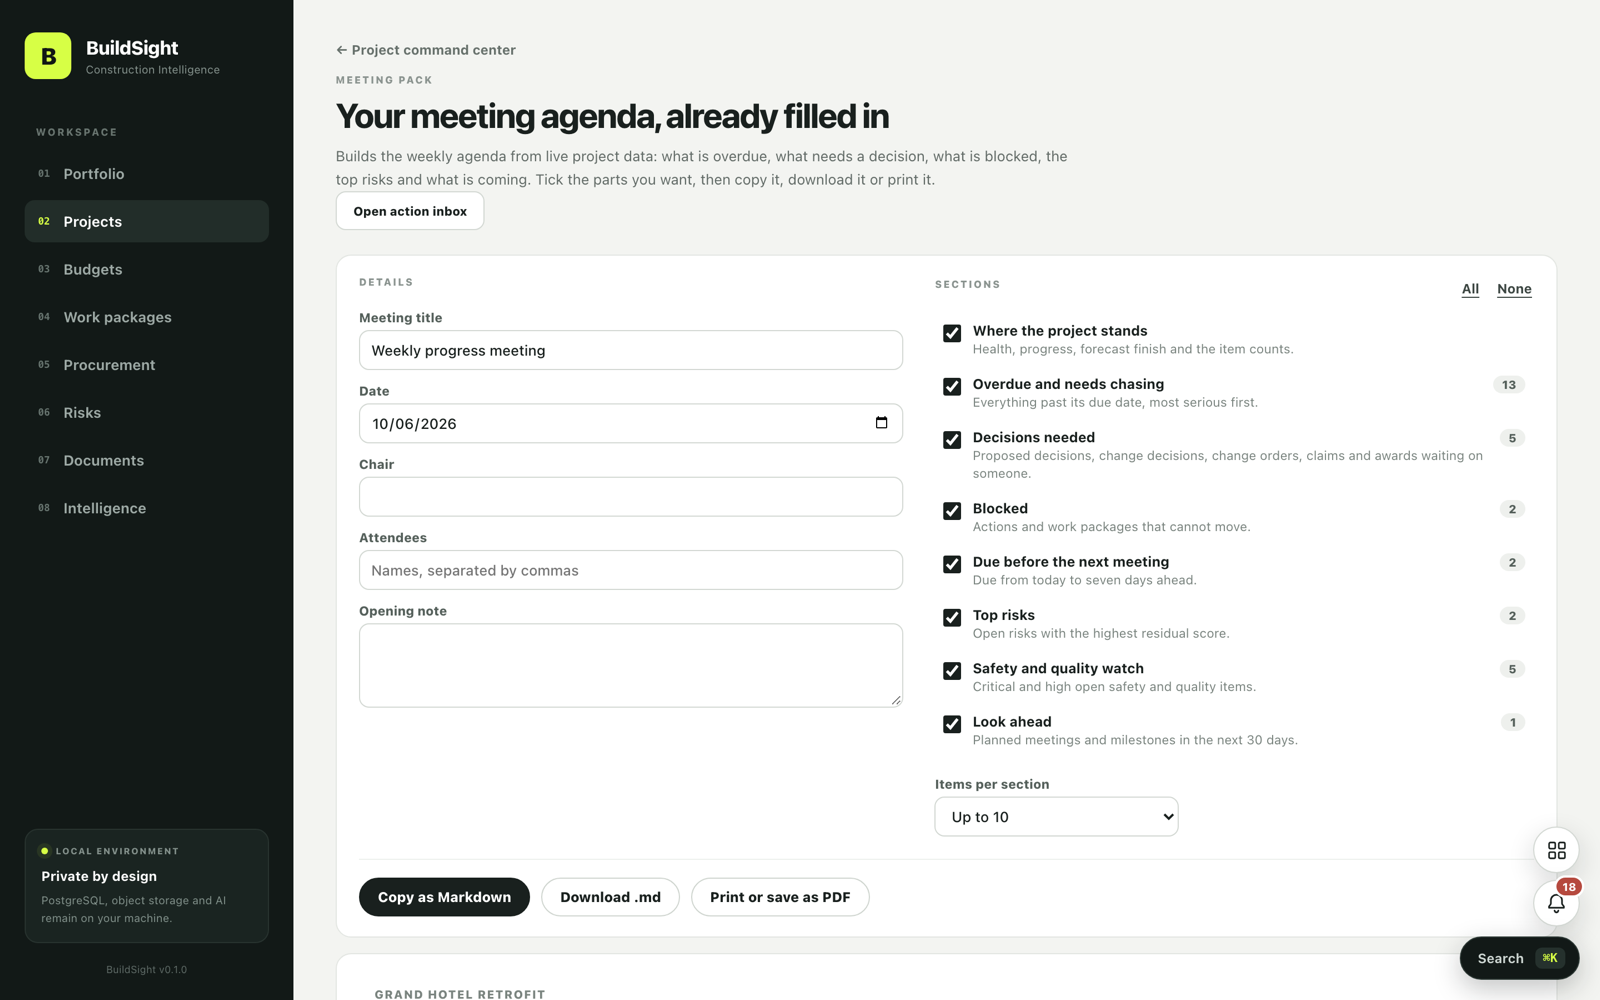 , Open the full-size image (opens in a new tab)
The meeting agenda, already filled in. 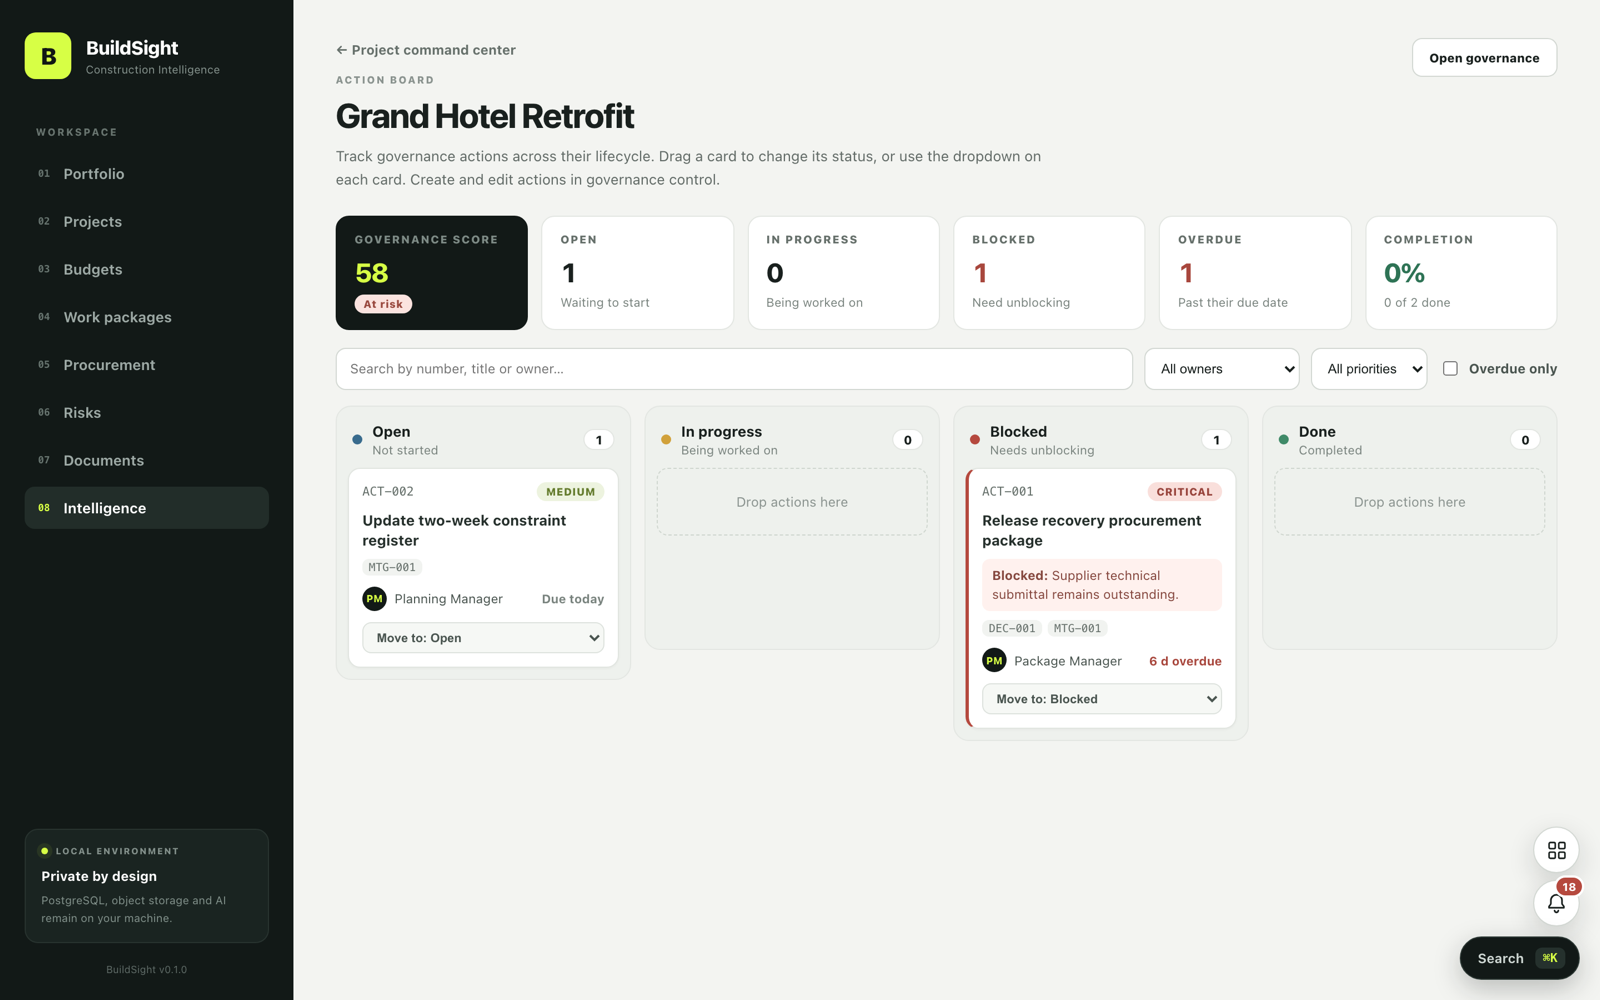 , Open the full-size image (opens in a new tab)
The action board, with drag and drop. 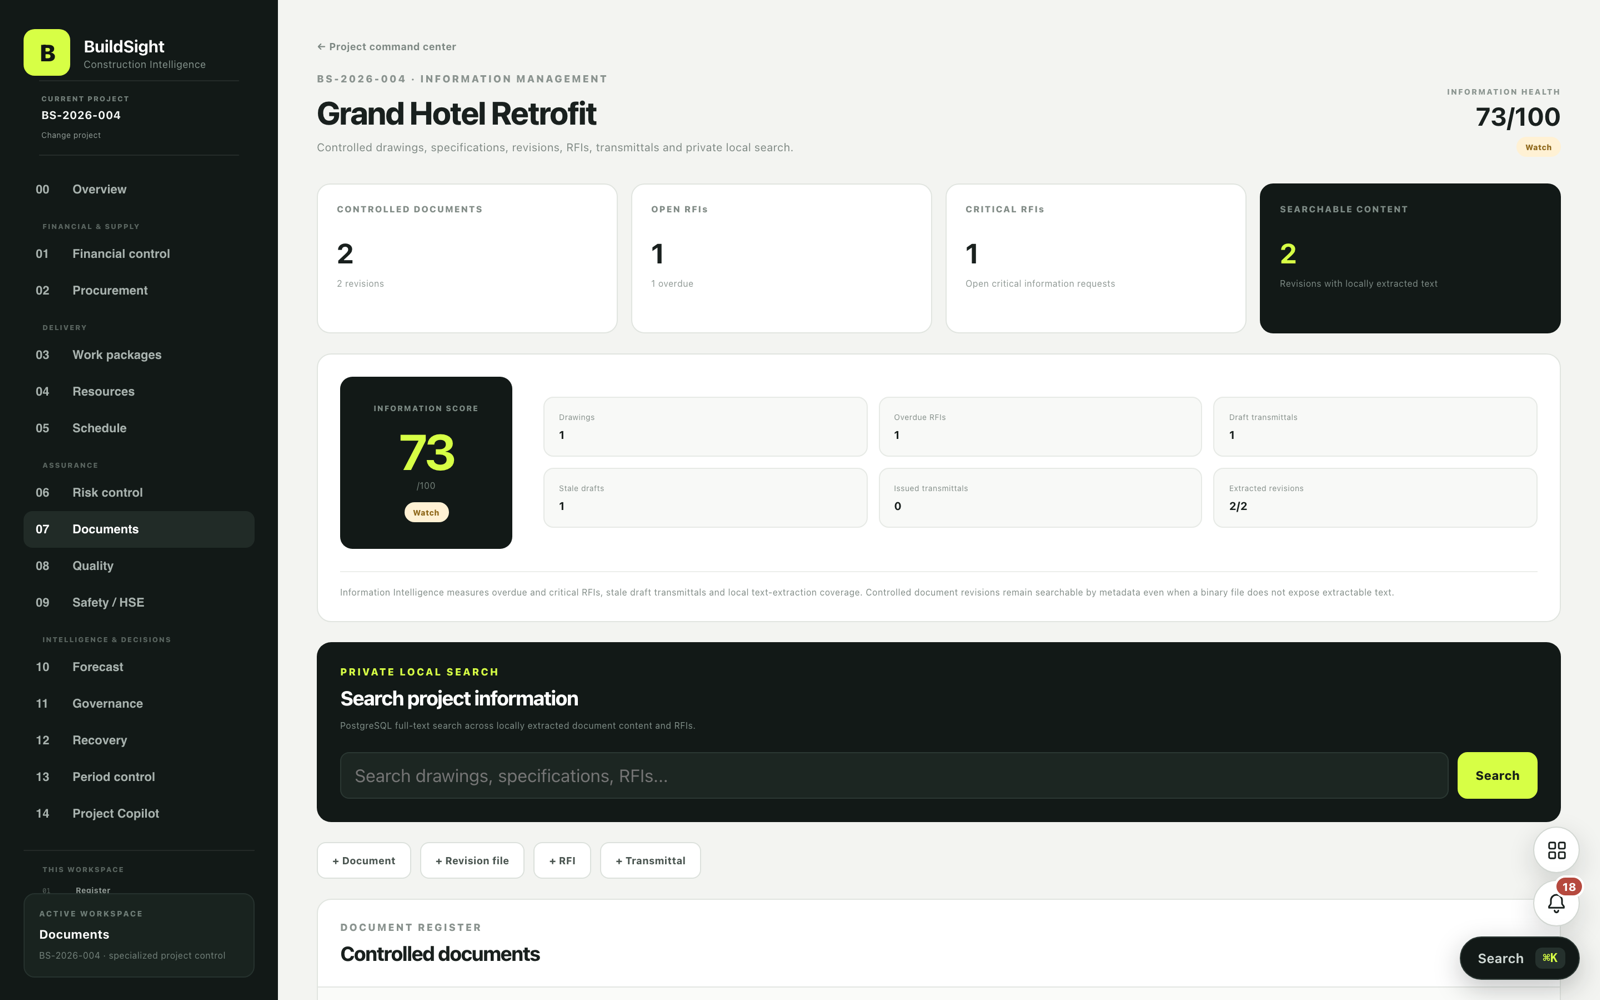 , Open the full-size image (opens in a new tab)
Documents, RFIs and project search.
How it's built
| Layer | Technology |
|---|---|
| Backend | Java 25 and Spring Boot 4.1, a REST API under /api/v1, calculation engines in the service layer |
| Database | PostgreSQL, with every schema change as a Flyway migration, started with Docker Compose |
| Frontend | Next.js 16 App Router, React 19, TypeScript, CSS Modules |
| Quality | A Playwright browser audit of every route at desktop and phone width, and the TypeScript type check |
Results
- 126 routes, more than 80 of them focused feature pages.
- The audit opens every route with no failures.
- Every page is also checked at 390 px phone width.
- Ten label problems, two percentage problems and one phone-layout problem found and fixed through the audit.
What I would build next
- Add authentication and roles; the app currently assumes a trusted network.
- Cover the create, update and approve flows with automated tests.
- Tune the risk and governance thresholds with real site teams.
- Add email or chat alerts for the inbox.
What I learned
- Plain-language product design, one page for one question, is a strong constraint, and it made the data model easier to reason about.
- A read-only audit gives a large codebase a safety net long before a full test suite exists.
- Honest limits, such as no login yet and thresholds that are starting values, build more trust than claiming everything is finished.
Built with
- Java
- Spring Boot
- PostgreSQL
- Flyway
- Next.js
- React
- TypeScript
- Playwright